
JaCoCo is an excellent open-source toolkit to measure and capture code coverage when running JUnit tests. In this tutorial, we will learn to create test code coverage reports for JUnit 5 using the JaCoCo Maven Plugin.
1. JaCoCo Maven Plugin
1.1. JaCoCo
JaCoCo is a code coverage library developed by the EclEmma team. JaCoCo embeds a runtime agent in JVM, which scans the code paths traversed by the automated tests code and creates a report for those paths.
We can import the JaCoCo report into other more comprehensive DevOps code quality tools like SonarQube and Jenkins. These integrations help make the whole code quality process more measurable and transparent for the development teams.
For integrating with JUnit tests, using the JaCoComaven plugin is an excellent option. Check for the latest version on this link.
1.2. Plugin Configuration
The given code snippet is from the working configuration for JUnit5 Examples project.
<build>
<plugins>

<plugin>
	<groupId>org.apache.maven.plugins</groupId>
	<artifactId>maven-surefire-plugin</artifactId>
	<version>2.22.2</version>
	<configuration>
		<argLine>
			--illegal-access=permit
		</argLine>
		<testFailureIgnore>true</testFailureIgnore>
		<forkCount>2</forkCount>
		<reuseForks>true</reuseForks>
		<argLine>${surefireArgLine}</argLine>
	</configuration>
</plugin>

<plugin>
	<groupId>org.jacoco</groupId>
	<artifactId>jacoco-maven-plugin</artifactId>
	<version>0.8.7</version>
	<executions>
		<execution>
			<id>default-prepare-agent</id>
			<goals>
				<goal>prepare-agent</goal>
			</goals>
			<configuration>
				<destFile>${project.build.directory}/coverage-reports/jacoco.exec</destFile>
				<propertyName>surefireArgLine</propertyName>
			</configuration>
		</execution>
		<execution>
			<id>default-report</id>
			<phase>test</phase>
			<goals>
				<goal>report</goal>
			</goals>
			<configuration>
				<dataFile>${project.build.directory}/coverage-reports/jacoco.exec</dataFile>
				<outputDirectory>${project.reporting.outputDirectory}/jacoco</outputDirectory>
			</configuration>
		</execution>
		<execution>
			<id>default-check</id>
			<goals>
				<goal>check</goal>
			</goals>
			<configuration>
				<rules>
					<rule>
						<element>BUNDLE</element>
						<limits>
							<limit>
								<counter>COMPLEXITY</counter>
								<value>COVEREDRATIO</value>
								<minimum>0.70</minimum>
							</limit>
						</limits>
					</rule>
				</rules>
			</configuration>
		</execution>
	</executions>
</plugin>

</plugins>
</build>
Note that the pre-execution goal default-prepare-agent prepares the agent to be configured and added to the command line. This agent does the code analysis for reporting purposes.
The post-execution goal default-report ensures that the reports get created in the output folder. The previously initialized agent gathers test coverage information when the tests are run and produces the report.
Finally, the created command-line change has to be inserted into the maven-surefire-plugin as shown in configuration/argLine option.
Failing these steps will result in a “Skipping JaCoCo execution due to missing execution data file” error.
Refer to JaCoCo check options page to check that the code coverage metrics are being met.
2. How to Generate the Code Coverage Report
Run the mvn package command. The package command will invoke the test phase during the packaging of the project jar or war file.
In the test phase, JaCoCo agent will initialize and run the code coverage analysis while the tests are executed. Read the JaCoCo documentation for more detailed information on how jacoco works.
mvn packageNotice the console output for coverage-related messages and cyclomatic complexity.
[INFO] --- jacoco-maven-plugin:0.8.7:prepare-agent (default-prepare-agent) @ JUnit5Examples ---
[INFO] surefireArgLine set to -javaagent:C:\\devsetup\\m2\\org\\jacoco\\org.jacoco.agent\\0.8.7\\org.jacoco.agent-0.8.7-runtime.jar
=destfile=C:\\devsetup\\gitrepo\\Junit5Examples\\JUnit5Examples\\target\\coverage-reports\\jacoco.exec

...
//===TEST EXECUTIONS RESULTS===
...

Please refer to C:\devsetup\gitrepo\Junit5Examples\JUnit5Examples\target\surefire-reports for the individual test results.
Please refer to dump files (if any exist) [date].dump, [date]-jvmRun[N].dump and [date].dumpstream.
[INFO]
[INFO] --- jacoco-maven-plugin:0.8.7:report (default-report) @ JUnit5Examples ---
[INFO] Loading execution data file C:\devsetup\gitrepo\Junit5Examples\JUnit5Examples\target\coverage-reports\jacoco.exec
[INFO] Analyzed bundle 'JUnit5Examples' with 1 classes
[INFO]
[INFO] --- maven-jar-plugin:2.4:jar (default-jar) @ JUnit5Examples ---
[INFO] Building jar: C:\devsetup\gitrepo\Junit5Examples\JUnit5Examples\target\JUnit5Examples-0.0.1-SNAPSHOT.jar
[INFO] ------------------------------------------------------------------------
[INFO] BUILD SUCCESS
[INFO] ------------------------------------------------------------------------
Now we can check the target folder in the project build directory.
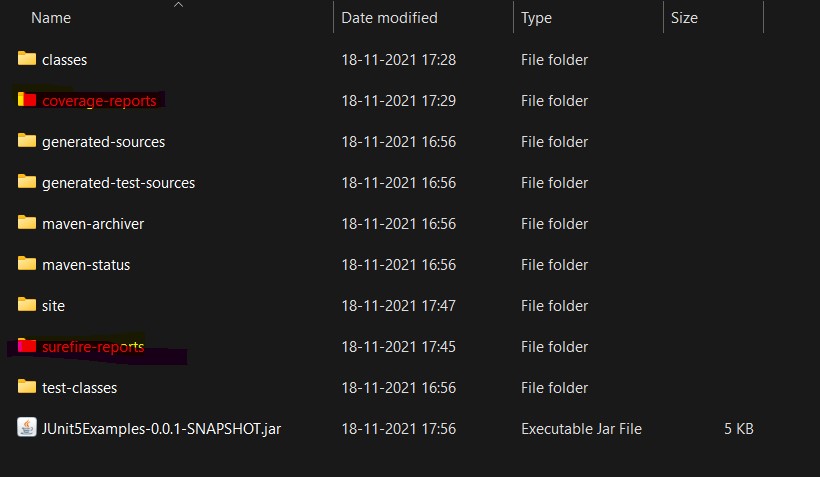
Now Navigate to target/site folder. We will find the jacoco folder there. It has the code coverage analysis report.

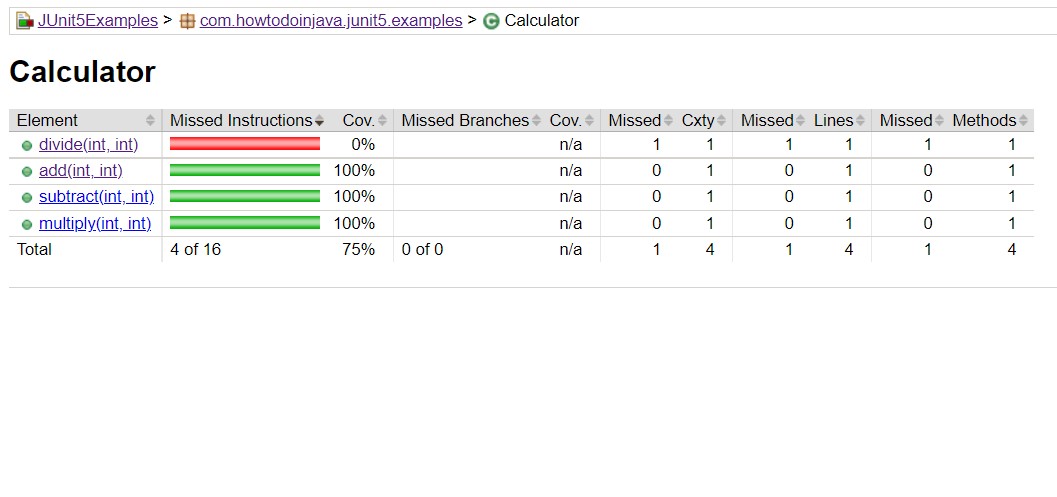
Now Open the file 'target\site\jacoco\index.html' in browser. You should see a similar report in the browser. Obviously, the number of successes and failures will be project-specific.

3. How to Improve Code Coverage Percentage
More tests need to be introduced to achieve better code coverage that test the code that was not covered earlier via the previous test implementations.
To demonstrate it, let us add more tests in our AppTest.java file.
Previously, we had only one test for add() operation. Our code coverage was 25%. Let us add two more tests. The newly added tests should bring the code coverage percentage to 75%.
@Test
void testCalAdd()
{
    Assertions.assertEquals( 4 , Calculator.add(2, 2));
}

@Test
void testCalSubtract()
{
    Assertions.assertEquals( 2 , Calculator.subtract(4, 2));
}

@Test
void testCalMultiply()
{
    Assertions.assertEquals( 4 , Calculator.multiply(2, 2));
}
Now, verify the coverage report again.

The report also shows which methods were executed and which were missed or partially executed.
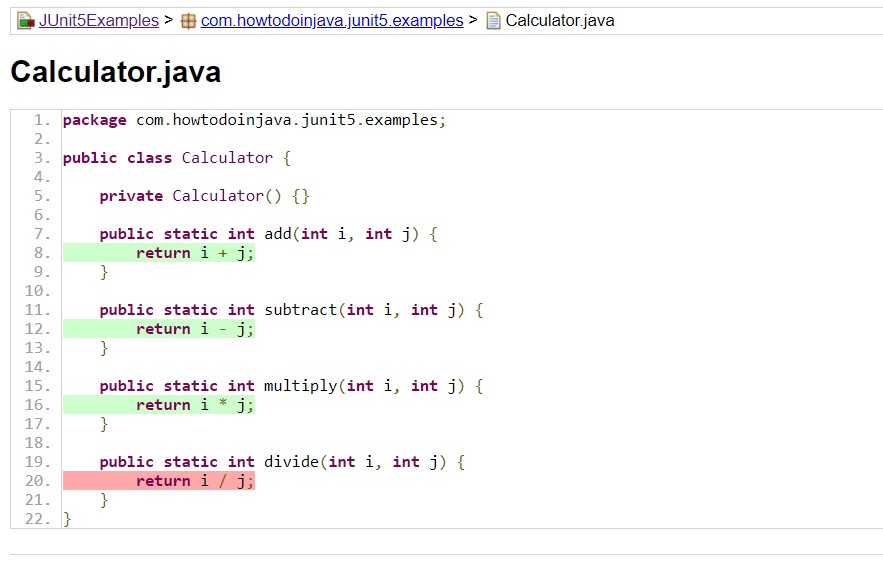
Click on the class names to know which lines are part of the test execution plan and are still not executed.
4. FAQs
4.1. Custom Report Destination Folder
Use the 'configuration\outputDirectory' property of maven goal report to configure the custom destination folder of the generated JaCoCo report.
The default report is generated at 'target/jscoco/site/*' location.
<execution>
	<id>default-report</id>
	<phase>test</phase>
	<goals>
		<goal>report</goal>
	</goals>
	<configuration>
		<dataFile>${project.build.directory}/coverage-reports/jacoco.exec</dataFile>
		<outputDirectory>${project.reporting.outputDirectory}/jacoco</outputDirectory>
	</configuration>
</execution>
4.2. Run JaCoCo in Eclipse
The best way to integrate JaCoCo with Eclipse is EclEmma Eclipse plugin.
The above link contains the most updated information for executing JaCoCo code coverage analysis in Eclipse IDE.
5. Conclusion
In this JaCoCo tutorial, we learned to configure the jacoco-maven-plugin into the application code and run the code coverage analysis report.
We also learned to interpret the report and improve the coverage percentage by adding more tests.
We learned about integrating the jacoco to Eclipse IDE and other configuration options to check that the code coverage metrics are being met.
Happy Learning !!