Spring boot and spring cloud are widely used while delivering microservices-based applications. Eventually, it has become a necessity to monitor microservices based on Spring boot applications running on different hosts. There are many tools available to monitor various health stats of these microservices.
In this spring cloud tutorial, we will learn to use three such monitoring tools i.e. Hystrix dashboard, Eureka admin dashboard and Spring boot admin dashboard.
Table of Contents

1. Overview
2. Technology stack
3. Employee Service
4. API-Gateway application
5. Hystrix dashboard view
6. Eureka admin dashboard view
7. Spring boot admin dashboard view
1. Overview
In this demo, we will create three applications.
- Employee Service – This microservice application is responsible to fetch data of Employees.
- Api-Gateway – This application is to provide common gateway while accessing different microservices. In the following example it will act as a gateway to Employee Service above.
- Eureka Server – This microservice application will provide service discovery and registration of above microservices.
This demo has been created around Netflix Eureka to centrally manage and monitor registered applications. As you may already know that Netflix Eureka server is for building service registry server and associated Eureka clients, which will register themselves to lookup other services and communicate through REST apis.
2. Technology stack
- Java 1.8
- Spring tool suite
- Spring cloud
- Spring boot
- Spring Rest
- Maven
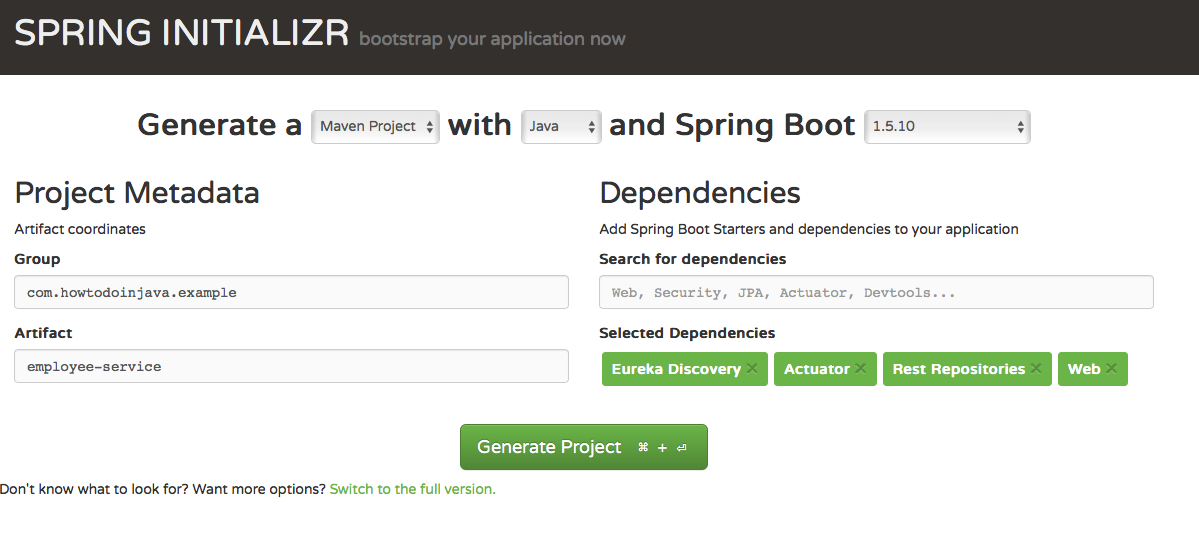
3. Employee Service
- Create a Spring boot project from Spring boot initializer/Spring tool suite with dependencies Eureka Discovery, Actuator, Web, Rest repositories.
- The main application class
EmployeeServiceApplicationto start the Spring boot application.package com.howtodoinjava.example.employee; import org.springframework.boot.SpringApplication; import org.springframework.boot.autoconfigure.SpringBootApplication; import org.springframework.cloud.netflix.eureka.EnableEurekaClient; @SpringBootApplication @EnableEurekaClient public class EmployeeServiceApplication { public static void main(String[] args) { SpringApplication.run(EmployeeServiceApplication.class, args); } }@EnableEurekaClient – This annotation register this service as an Eureka client in Eureka Server application created below.
- Create a Rest controller class [EmployeeServiceController] to expose Employee data.
package com.howtodoinjava.example.employee.controller;

import java.util.HashMap;
import java.util.Map;

import org.springframework.web.bind.annotation.PathVariable;
import org.springframework.web.bind.annotation.RequestMapping;
import org.springframework.web.bind.annotation.RequestMethod;
import org.springframework.web.bind.annotation.RestController;

import com.howtodoinjava.example.employee.beans.Employee;

@RestController
public class EmployeeServiceController {


	private static final Map<Integer, Employee> employeeData = new HashMap<Integer,Employee() {

    	private static final long serialVersionUID = -3970206781360313502L;
    	{
    		put(111,new Employee(111,"Employee1"));
    		put(222,new Employee(222,"Employee2"));
    	}
    };

    @RequestMapping(value = "/findEmployeeDetails/{employeeId}", method = RequestMethod.GET)
    public Employee getEmployeeDetails(@PathVariable int employeeId) {
        System.out.println("Getting Employee details for " + employeeId);

        Employee employee = employeeData.get(employeeId);
        if (employee == null) {

        	employee = new Employee(0, "N/A");
        }
        return employee;
    }
}
Associated
EmployeeBean class is below.package com.howtodoinjava.example.employee.beans; public class Employee { private String name; private int id; @Override public String toString() { return "Employee [name=" + name + ", id=" + id + "]"; } } - Create
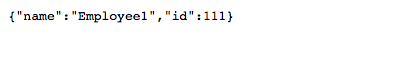
application.ymlinsrc/main/resourcesdirectory.server: port: 8011 eureka: instance: leaseRenewalIntervalInSeconds: 5 leaseExpirationDurationInSeconds: 2 client: serviceUrl: defaultZone: http://localhost:8761/eureka/ healthcheck: enabled: true lease: duration: 5 spring: application: name: employee-service management: security: enabled: false logging: level: com.self.sprintboot.learning.employee: DEBUG - Start this application reachable
http://localhost:8011/findEmployeeDetails/111
4. API-Gateway with Hystrix
- Create a Spring boot project from Spring boot initializer/Spring tool suite with dependencies
Eureka Discovery,Actuator,Web,Hystrix,Hystrix Dashboard,Rest repositories.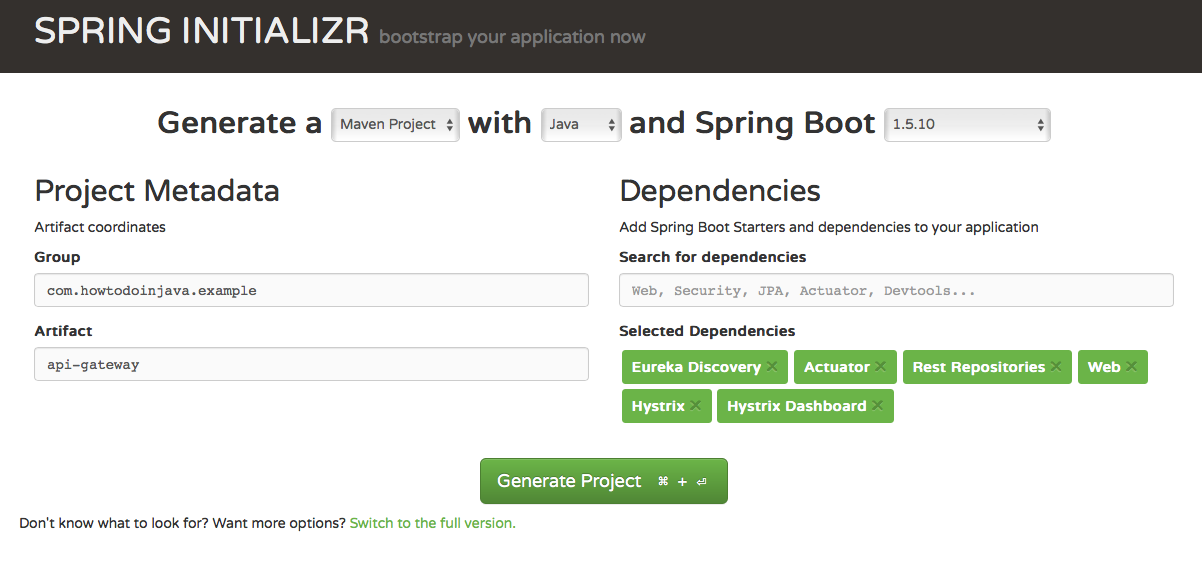
- The main application class
ApiGatewayApplicationto start Spring boot application.package com.howtodoinjava.example.apigateway; import org.springframework.boot.SpringApplication; import org.springframework.boot.autoconfigure.SpringBootApplication; import org.springframework.cloud.client.circuitbreaker.EnableCircuitBreaker; import org.springframework.cloud.netflix.eureka.EnableEurekaClient; import org.springframework.cloud.netflix.hystrix.dashboard.EnableHystrixDashboard; @SpringBootApplication @EnableEurekaClient @EnableHystrixDashboard @EnableCircuitBreaker public class ApiGatewayApplication { public static void main(String[] args) { SpringApplication.run(ApiGatewayApplication.class, args); } }@EnableHystrixDashBoard – To give dashboard view of Hystrix stream.
@EnableCircuitBreaker – To enable Circuit breaker implementation. - Create a REST controller class [ EmployeeController ] to expose Employee data.
package com.howtodoinjava.example.apigateway.controller; import org.springframework.beans.factory.annotation.Autowired; import org.springframework.cloud.client.loadbalancer.LoadBalanced; import org.springframework.context.annotation.Bean; import org.springframework.core.ParameterizedTypeReference; import org.springframework.http.HttpMethod; import org.springframework.web.bind.annotation.PathVariable; import org.springframework.web.bind.annotation.RequestMapping; import org.springframework.web.bind.annotation.RequestMethod; import org.springframework.web.bind.annotation.RestController; import org.springframework.web.client.RestTemplate; import com.netflix.hystrix.contrib.javanica.annotation.HystrixCommand; @RestController public class EmployeeController { @Autowired RestTemplate restTemplate; @RequestMapping(value = "/employeeDetails/{employeeid}", method = RequestMethod.GET) @HystrixCommand(fallbackMethod = "fallbackMethod") public String getStudents(@PathVariable int employeeid) { System.out.println("Getting Employee details for " + employeeid); String response = restTemplate.exchange("http://employee-service/findEmployeeDetails/{employeeid}", HttpMethod.GET, null, new ParameterizedTypeReference<String>() {}, employeeid).getBody(); System.out.println("Response Body " + response); return "Employee Id - " + employeeid + " [ Employee Details " + response+" ]"; } public String fallbackMethod(int employeeid){ return "Fallback response:: No employee details available temporarily"; } @Bean @LoadBalanced public RestTemplate restTemplate() { return new RestTemplate(); } } - Create
application.ymlinsrc/main/resourcesdirectory.server: port: 8010 #port number eureka: instance: leaseRenewalIntervalInSeconds: 5 leaseExpirationDurationInSeconds: 2 client: serviceUrl: defaultZone: http://localhost:8761/eureka/ healthcheck: enabled: true lease: duration: 5 spring: application: name: api-gateway management: security: enabled: false logging: level: com.self.sprintboot.learning.apigateway: DEBUG - Start the application reachable at
http://localhost:8010/employeeDetails/111.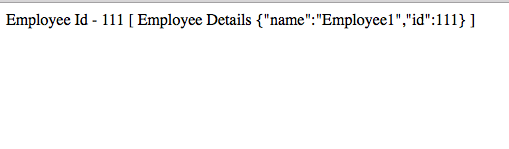
5. Hystrix dashboard view
- To monitor via Hystrix dashboard, open Hystrix dashboard at
http://localhost:8010/hystrix.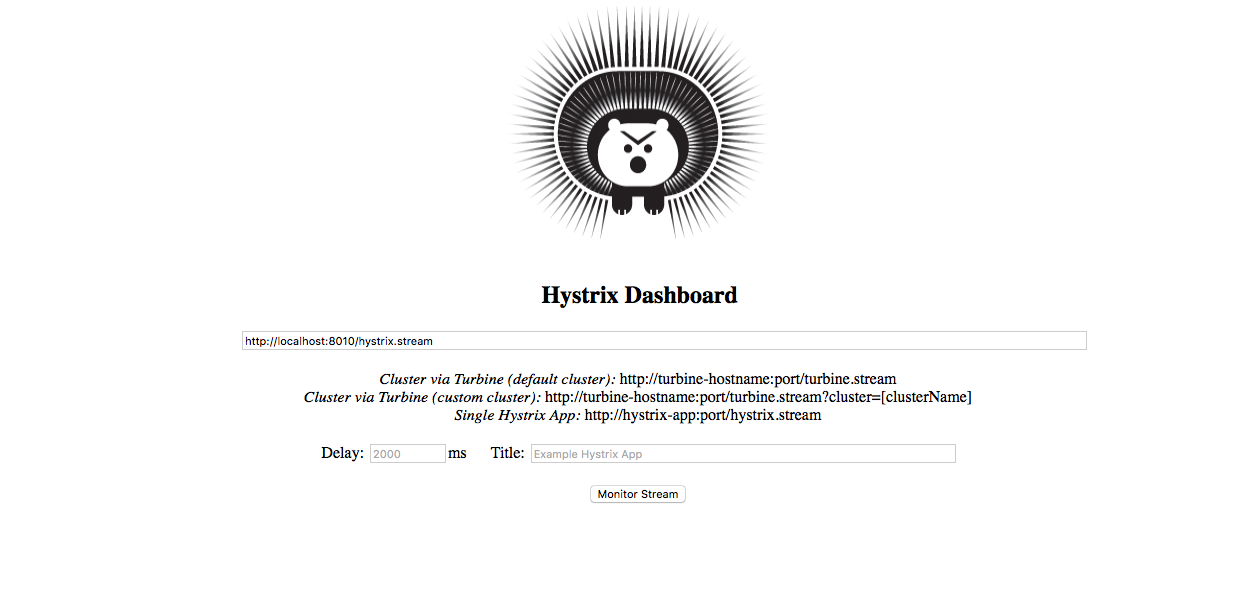
This is the home page where event stream URL needs to be put for monitoring.
- Now view hystrix stream in dashboard –
http://localhost:8010/hystrix.stream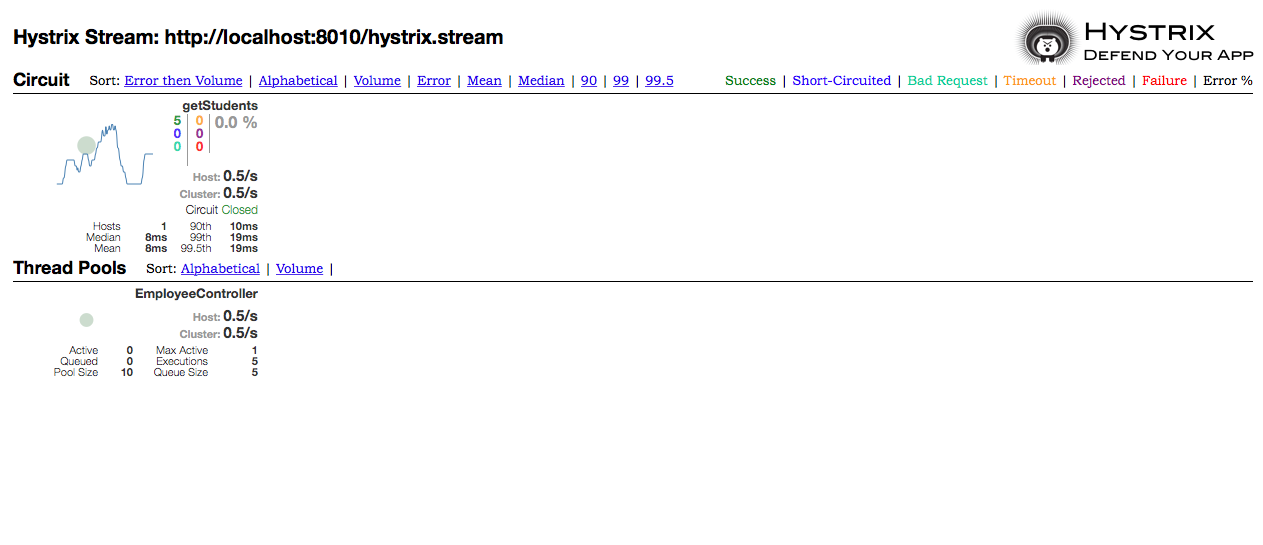
This provides realtime information of all Hystrix commands and thread pools.
6. Eureka admin dashboard view
Now let’s learn to use the Eureka admin dashboard view.
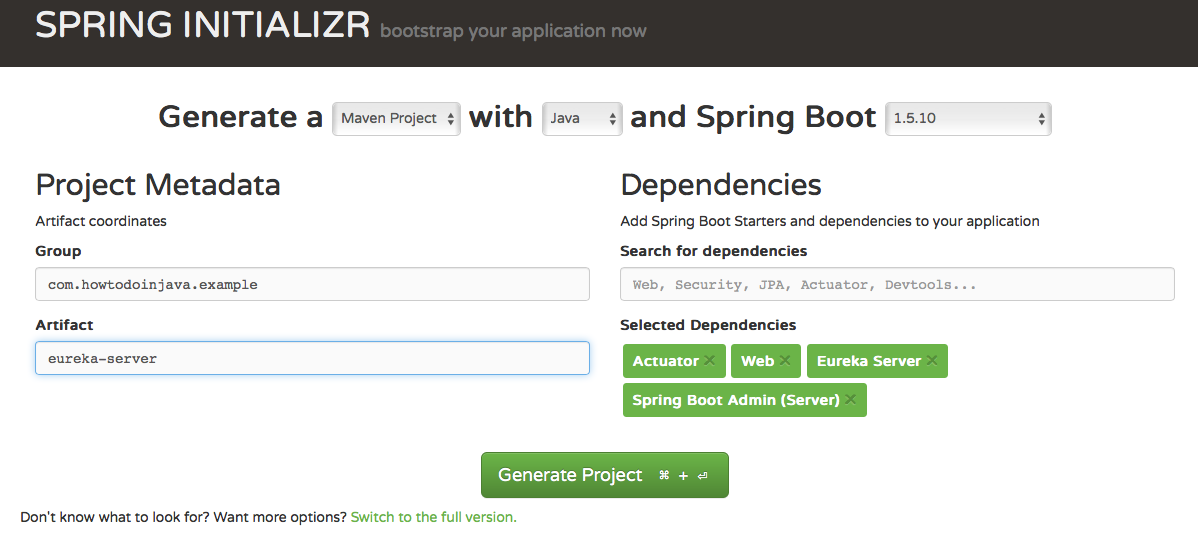
- Create a Spring boot project from Spring boot initializer/Spring tool suite with these dependencies Eureka Server, Actuator, Web, Spring Boot Admin Server.
- The main application class
EurekaServerApplicationto start spring boot application.package com.howtodoinjava.example.eureka; import org.springframework.boot.SpringApplication; import org.springframework.boot.autoconfigure.SpringBootApplication; import org.springframework.cloud.netflix.eureka.server.EnableEurekaServer; import de.codecentric.boot.admin.config.EnableAdminServer; @SpringBootApplication @EnableEurekaServer @EnableAdminServer public class EurekaServerApplication { public static void main(String[] args) { SpringApplication.run(EurekaServerApplication.class, args); } }@EnableEurekaServer– This annotation will make this application to act as Microservice registry and discovery server.
@EnableAdminServer – This annotation provides Spring Boot Admin configuration. - Create
application.ymlandbootstrap.ymlinsrc/main/resourcesdirectory. - Add
application.ymlwith given config. Please note that for Spring boot admin server a different context path/adminhas been provided for not conflicting with/eureka.server: port: ${PORT:8761} eureka: client: registryFetchIntervalSeconds: 5 registerWithEureka: false serviceUrl: defaultZone: ${DISCOVERY_URL:http://localhost:8761}/eureka/ instance: leaseRenewalIntervalInSeconds: 10 management: security: enabled: false spring: boot: admin: context-path: /admin #A different context path for Spring boot admin server has been provided avoiding conflict with eureka - Create
bootstrap.ymland give this configuration.spring: application: name: Eureka-Server cloud: config: uri: ${CONFIG_SERVER_URL:http://localhost:8888} - Start the application. But before that make sure the rest of the client applications mentioned above are started before so as to see all registered applications. This application is reachable at
http://localhost:8761.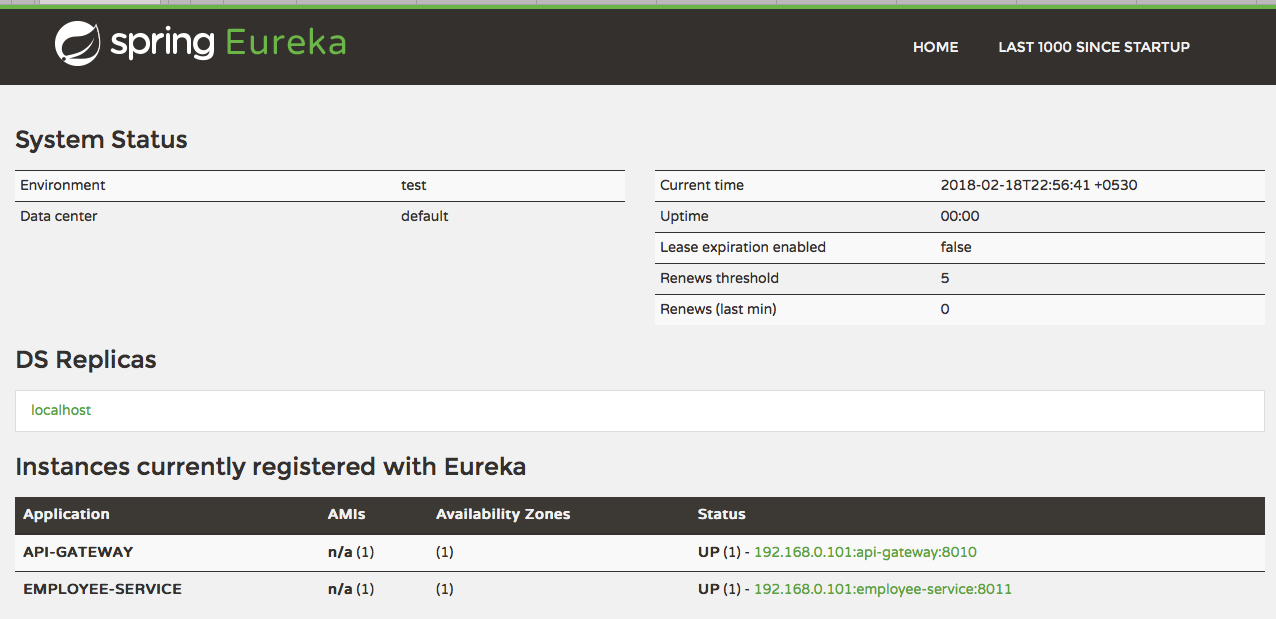
7. Spring boot admin dashboard view
- To monitor via Spring Boot Admin server, invoke this URL running at different context path-
http://localhost:8761/admin.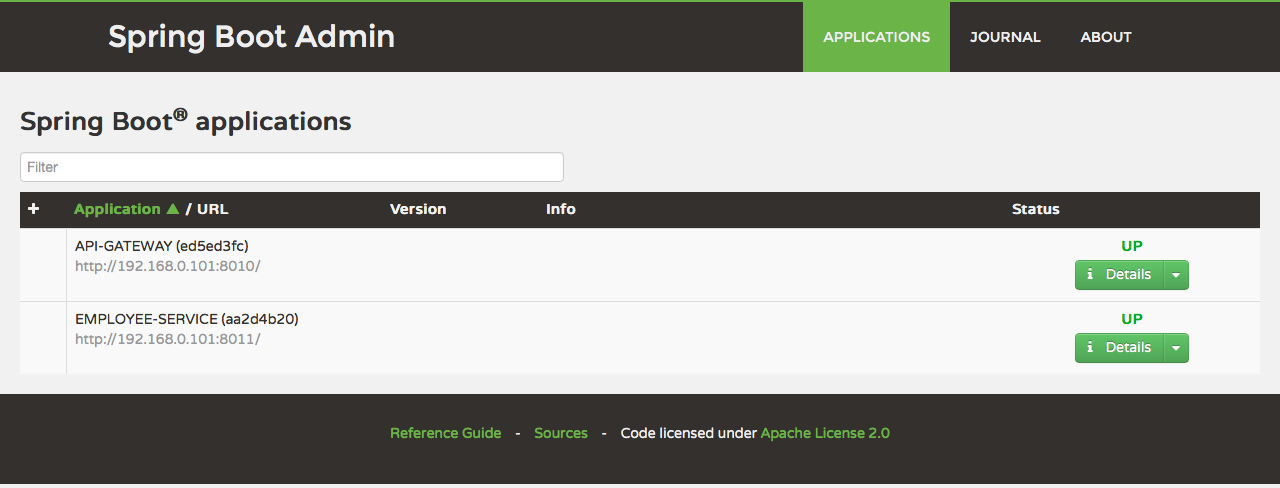
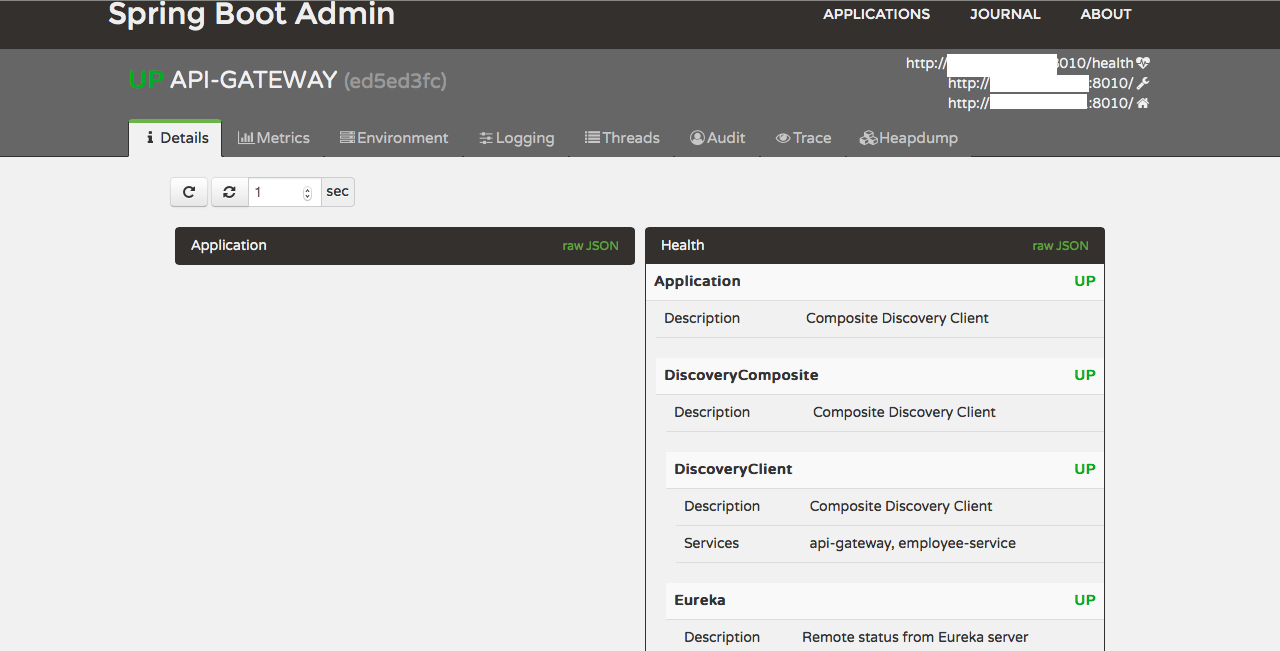
- This admin interface provides application overview, desktop notifications, application health check, log file browsing, JMX Beans, thread heap dump etc. To see individual application health and monitor its metrics, click on the detail button. It will take you to the admin dashboard of individual application.
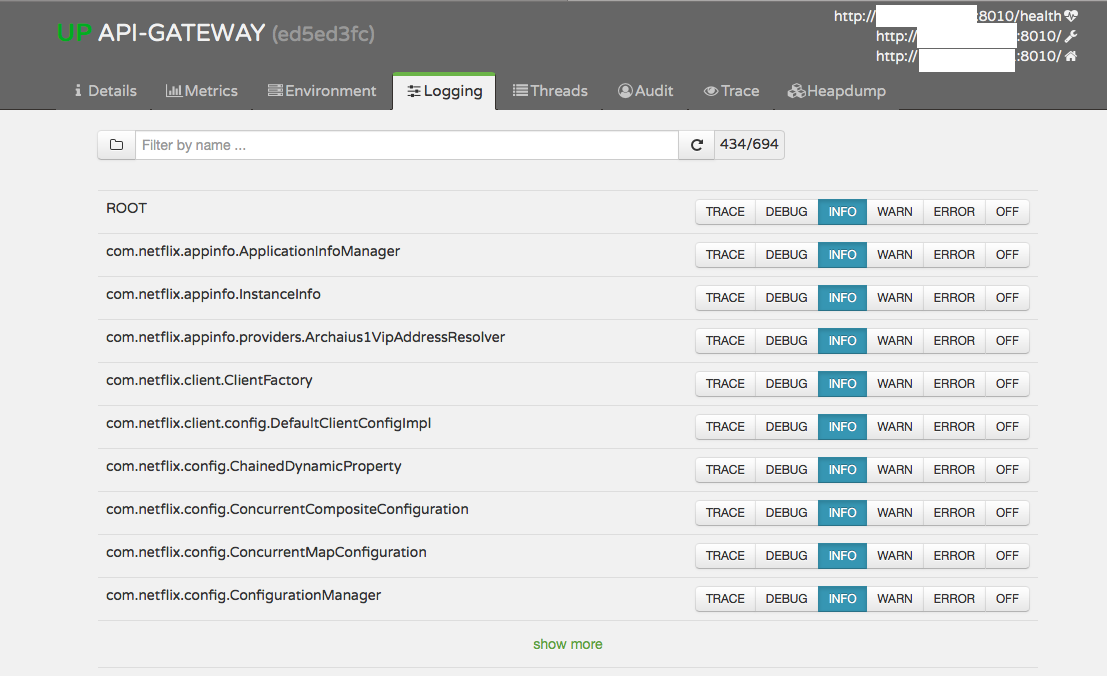
- Using dashboard to manage log levels.
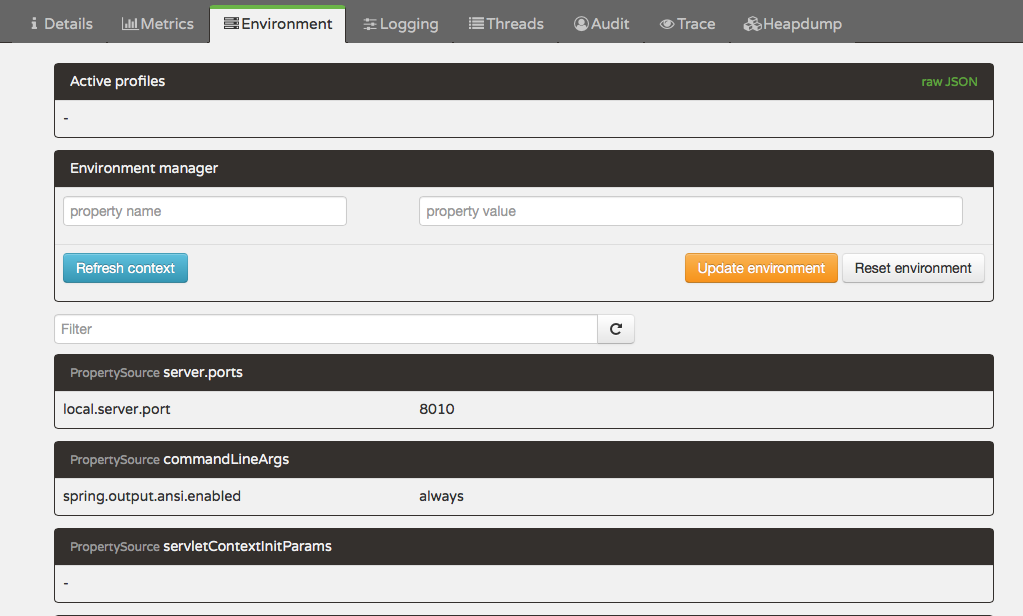
- Using dashboard to manage runtime environment properties.
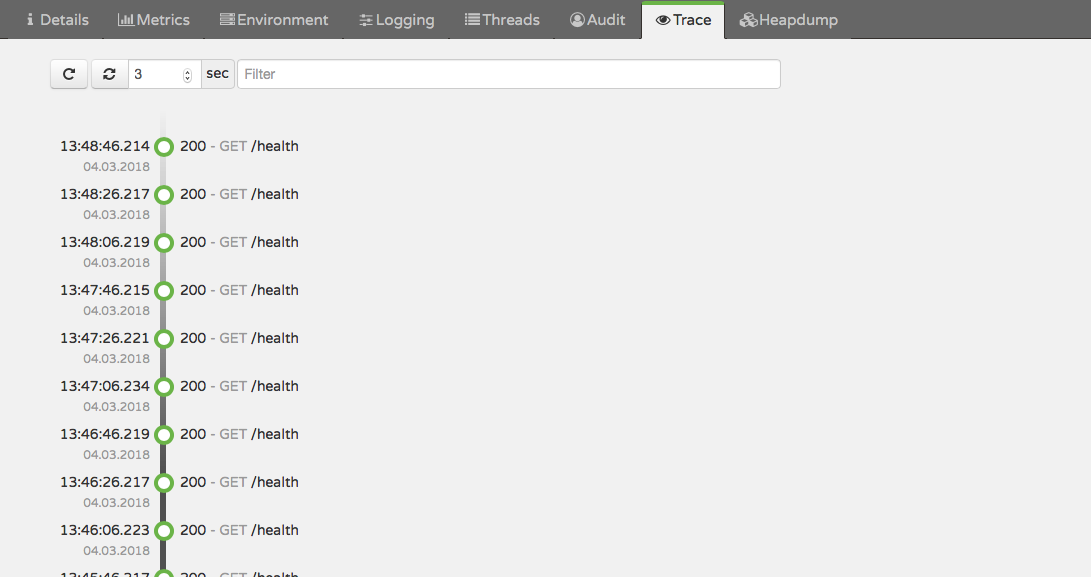
- Also you can use it to view HTTP traces.
That’s for now from Spring boot admin perspective. Please feel free to add any comments/query. We will be happy to address the same.
Happy Learning !!
Thanks a lot, very good explanation!!!
com.netflix.discovery.shared.transport.TransportException: Cannot execute request on any known serverCan you please help me..?
thanks, application.yml file configuration : need register client to Spring Boot Admin server
Can you explain more about this?
very good tutorial to understand springcloud concepts. Thank you!!!
I downloaded all three applications and executed them.
But,
http://localhost:8010/employeeDetails/111
does not give the result. It always call the fallback method.
Please try once and see.
:(
add setter and getter methods in Employee
I have getter setter method still facing same problem.
does not give the result. It always call the fallback method.
vishal how u resolve this issue
Hi there,
I’ve one question : Why you are creating application.yml files ?
we can also specify these configuration in application.properties file.?
then whats the difference ?
No difference. It’s matter of choice.
application.yml file gives more readability compared to application.properties file
u must share what is the use of whatevr written in yml othrwise no one will think of reading it
I’m unable to connect to micro-service to Sprin-boot-admin.
We’re just using SBA with Micro-services.
Do we need to use Eureka for client discovery?
Yes, for micro-services you need Eureka. If possible, use ZUUL as well.
Really thank you very much for you time and tutorials.
it would be great if you can share .properties file of .yml files of this tutorials.
Everything is inside sourcecode folders.
Thank you very much.
Fantastic !!! Easy to learn … Thanks for your great work!