Whenever we execute a Java program, a separate memory area is reserved for storing various parts of our application code which we roughly call JVM memory. Though not necessary, having some knowledge about the structuring of this memory area is quite beneficial.
Knowing Java memory model becomes more important when we start working on complex tasks like performance tuning. Without having a good understanding of how JVM actually consumes the memory and how garbage collector uses different parts of this volatile memory, we may miss some important considerations for better memory management, thus better performance.
In this tutorial, we are discussing the various parts inside JVM memory, and then in one of my future posts, we will discuss how to use this information for the performance tuning of the application.
Table of Contents

1. Java Memory Model Structure
	- 1.1. Heap area
	- 1.2. Method area and runtime constant pool
	- 1.3. JVM stack
	- 1.4. Native method stacks
	- 1.5. PC registers
2. Conclusion
1. Java Memory Model Structure
The Java Virtual Machine defines various run-time data areas that are used during execution of a program.
Some of these data areas are created on JVM start-up and are destroyed only when the JVM exits. Other data areas are created and exist one per thread. Per-thread data areas are created when a thread is created and destroyed when the thread exit.
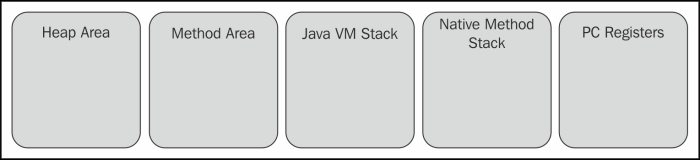
Let’s look at the most basic categorization of various parts inside runtime memory.
Let’s have a quick look at each of these components according to what is mentioned in the JVM specifications.
1.1. Heap memory
The heap area represents the runtime data area, from which the memory is allocated for all class instances and arrays, and is created during the virtual machine startup.
The heap storage for objects is reclaimed by an automatic storage management system. The heap may be of a fixed or dynamic size (based on system’s configuration), and the memory allocated for the heap area does not need to be contiguous.
A Java Virtual Machine implementation may provide the programmer or the user control over the initial size of the heap, as well as if the heap can be dynamically expanded or contracted, control over the maximum and minimum heap size.
OutOfMemoryError.1.2. Method area and runtime constant pool
Method area stores per-class structures such as the runtime constant pool; field and method data; the code for methods and constructors, including the special methods used in class, instance, and interface initialization.
The method area is created on the virtual machine startup. Although it is logically a part of the heap it can or cannot be garbage collected, whereas we already read that garbage collection in heap is not optional; it’s mandatory. The method area may be of a fixed size or may be expanded as required by the computation and may be contacted if a larger method area becomes unnecessary. The memory for the method area does not need to be contiguous.
OutOfMemoryError.1.3. Stacks
Each of the JVM threads has a private stack created at the same time as that of the thread. The stack stores frames. A frame is used to store data and partial results and to perform dynamic linking, return values for methods, and dispatch exceptions.
It holds local variables and partial results and plays a part in the method invocation and return. Because this stack is never manipulated directly, except to push and pop frames, the frames may be heap-allocated. Similar to the heap, the memory for this stack does not need to be contiguous.
This specification permits that stacks can be either of a fixed or dynamic size. If it is of a fixed size, the size of each stack may be chosen independently when that stack is created.
StackOverflowError.OutOfMemoryError. 1.4. Native method stacks
Native method stacks are called C stacks; they support native methods (methods are written in a language other than the Java programming language), typically allocated per each thread when each thread is created. Java Virtual Machine implementations that cannot load native methods and that do not themselves rely on conventional stacks need not supply native method stacks.
The size of native method stacks can be either fixed or dynamic.
StackOverflowError.OutOfMemoryError.1.5. PC registers
Each of the JVM threads has its own program counter (pc) register. At any point, each of the JVM threads is executing the code of a single method, namely the current method for that executing thread.
As the Java applications can contain some native code (for example, using native libraries), we have two different ways for native and non-native methods. If the method is not native (that is, a Java code), the PC register contains the address of the JVM instruction currently being executed. If the method is native, the value of the JVM’s PC register is undefined.
The Java Virtual Machine’s pc register is wide enough to hold a return address or a native pointer on the specific platform.
2. Conclusion
We learned about Java memory model and its memory area and structuring inside JVM. We will come up with ideas to use this information for performance tuning in the coming posts.
Happy Learning !!
Reference: http://docs.oracle.com/javase/specs/jvms/se7/html/jvms-2.html
Hi ,
I want to know
if two tomcat running on same machine then will they use same heap area or different ?
different
HI..
i want to know about how application developed by one program can be viewed by different kind of client like(tab,mobile,pc…)
Hi Lokesh,
Could you explain why Native method stacks are needed and what is the main purpose of it in memory model of java.
Heap memory contains three components. Young, Old and Perm generation.
Logically, Method Area and runtime constant pool is also part of Heap memory’s Perm Gen – which Java people has planned to remove in JAVA 8. They are planning to have new structure ( Metaspace) in Java 8 instead of Perm Gen.
Correct me if I am wrong.
Regards, Uzair
You are absolutely right. It has already happened with latest release of JDK 8.
Hi Lokesh,
Thanks for your posts on Java. These are very clear and easy to understand. Will you pls explain more on Metaspace ? Is there any change in behavior for Metaspace from Perm Gen (like GC collection or any other in particular). As per my understanding, there will not be any major, in behavior.
Regards, Uzair
There are some big differences between them e.g. memory size limit etc. I will cover them soon in my next tutorial.
Will you please update the same for Java SE 8
Hi Ram, I don’t think there is any difference in terms of memory structuring inside JVM. It’s still same in java 8 as it was in java 7. Only major difference is removal of PermGen and introduction of Metaspace, but thats how JVM manages objects inside heap and method area. Please let me know if I am missing anything.
Hi Lokesh,
your blog awesome ! recently i got some requirements like i need to retrieve information from windows registry such as software/ hardware information So we will achieve this using java. can please guide me. do i need to use jRejestry jars ?
Absolutely no hands on experience before in this area. You are at your own this time.
thanks for yours quick response :)