
Measuring elapsed time in Java means reading System.nanoTime() before and after the code, subtracting the two values to get the elapsed nanoseconds, and wrapping the result in Duration.ofNanos() to read it in milliseconds or seconds. Because the nanoTime() clock never goes back, a change of the system time during the measurement does not affect the result.
We measure elapsed time to log how long a request, a database query or a batch job took, to enforce timeouts, and to find the slow step in a process. For comparing the speed of two small pieces of code, we use a benchmark tool instead, as section 6 explains.
The following example times a loop with the sumOfSquares() method from section 1. Each run prints different elapsed values, so the comments name what each line holds.
long start = System.nanoTime();
long total = sumOfSquares(1_000_000);                    // 333333833333500000
long elapsedNanos = System.nanoTime() - start;           // elapsed nanoseconds, differs per run
Duration elapsed = Duration.ofNanos(elapsedNanos);       // the same time as a Duration
long elapsedMillis = elapsed.toMillis();                 // elapsed whole milliseconds
Only the difference of two nanoTime() values means anything. We look at why this clock is the right one, convert the result to other units, measure with Instant and Duration, build a reusable helper, measure CPU time, and close with benchmarks.
1. Why System.nanoTime() Is the Right Clock
Java has two clocks. The wall clock, read by System.currentTimeMillis() and Instant.now(), tells the time of day, and the operating system can set it forward or back, for example when NTP corrects it. The monotonic clock, read by System.nanoTime(), counts from an arbitrary origin and only moves forward.
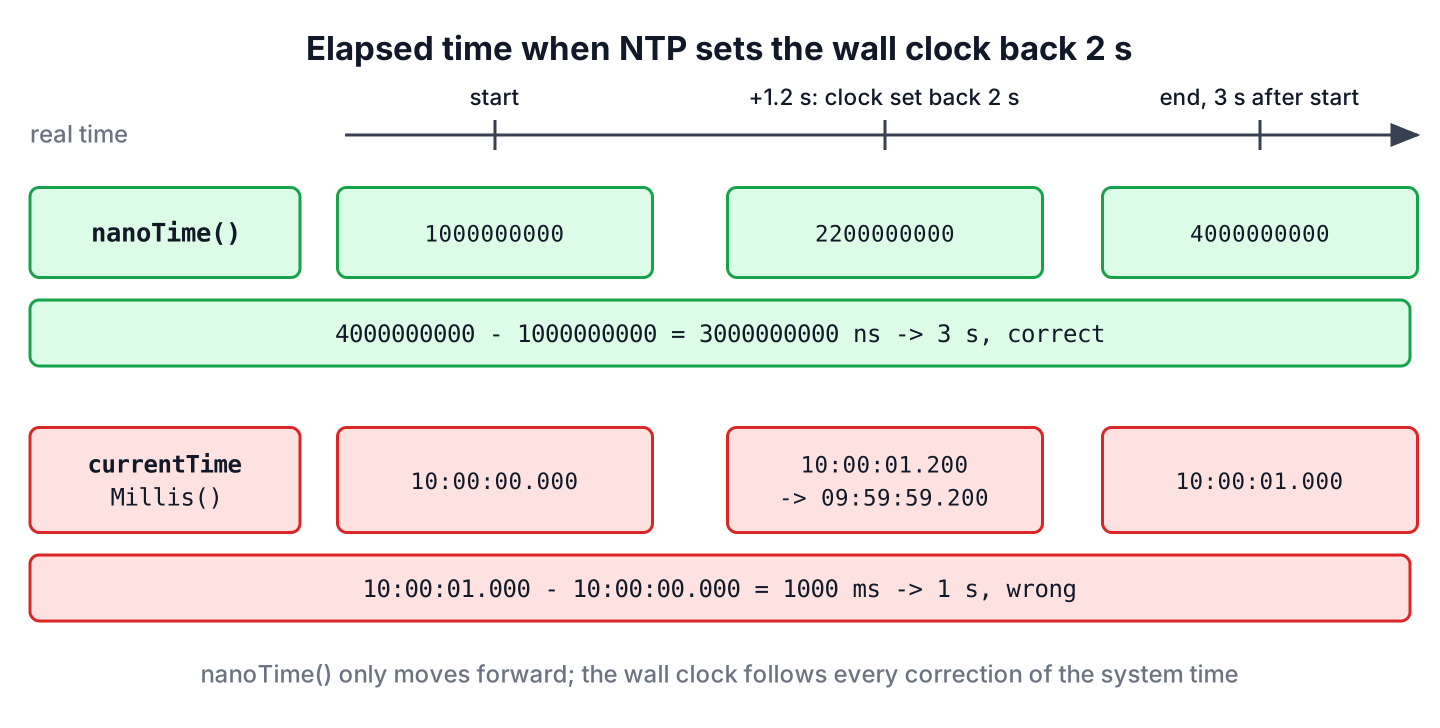
We use System.nanoTime() for every elapsed time inside one JVM, and the wall clock only for timestamps that must mean a time of day. The table compares the three methods.
| Method | Clock | Unit | Use for |
|---|---|---|---|
| System.nanoTime() | Monotonic, arbitrary origin | Nanoseconds | Elapsed time and timeouts in one JVM |
| System.currentTimeMillis() | Wall clock, epoch origin | Milliseconds | Timestamps; rough elapsed time |
| Instant.now() | Wall clock, epoch origin | Up to nanoseconds | Timestamps that are stored or sent |
All examples time the same plain loop, declared once.
static long sumOfSquares(int n) {
    long sum = 0;
    for (int i = 1; i <= n; i++) {
        sum += (long) i * i;
    }
    return sum;
}
The nanoTime() method has nanosecond precision, but not nanosecond resolution, so two calls in a row can differ by a few dozen nanoseconds or more, depending on the operating system. Its values can also be negative, so we compare two readings with a subtraction, such as now – deadline >= 0, and never with now >= deadline, which breaks if the counter wraps.
long timeoutNanos = TimeUnit.SECONDS.toNanos(2);
long deadline = System.nanoTime() + timeoutNanos;
boolean timedOut = System.nanoTime() - deadline >= 0;    // false, the 2 seconds have not passed
2. Converting Elapsed Nanoseconds to Milliseconds and Seconds
A raw count such as 3250400000 is hard to read in a log. The Duration class converts it to any unit, and TimeUnit does the same for plain long values. Both conversions cut off the remainder instead of rounding.
long elapsedNanos = 3_250_400_000L;
Duration elapsed = Duration.ofNanos(elapsedNanos);                     // PT3.2504S
long millis = elapsed.toMillis();                                      // 3250
long seconds = elapsed.toSeconds();                                    // 3
int millisPart = elapsed.toMillisPart();                               // 250
long millisWithTimeUnit = TimeUnit.NANOSECONDS.toMillis(elapsedNanos); // 3250
double secondsDecimal = elapsedNanos / 1_000_000_000.0;                // 3.2504
The toString() output PT3.2504S is the ISO-8601 duration format. To print a long job as 01:02:05, we use the toXxxPart() methods shown in formatting milliseconds to hh:mm:ss.
3. Measuring Between Two Instants With Duration
When the start and the end of a task are recorded as timestamps, often by different processes or on different days, we compute the elapsed time with Duration.between(). A nightly import job that writes its start and end time to a table is a typical case.
Instant jobStart = Instant.parse("2026-10-10T02:00:00Z");
Instant jobEnd = Instant.parse("2026-10-10T02:47:13.500Z");
Duration took = Duration.between(jobStart, jobEnd);           // PT47M13.5S
long tookSeconds = took.toSeconds();                          // 2833
boolean slow = took.compareTo(Duration.ofMinutes(30)) > 0;    // true
long minutesWithChronoUnit = ChronoUnit.MINUTES.between(jobStart, jobEnd);   // 47
Inside one running JVM, Instant.now() at the start and the end also gives a Duration, but it follows the wall clock, so a time correction during the task distorts the result. For the difference between calendar dates, such as days or months, the article on the difference between two dates uses Period and ChronoUnit.
4. A Reusable Helper That Times Any Task
Repeating the nanoTime() subtraction in every method makes the code noisy, and a missed line gives a wrong number. A small helper takes the task as a Supplier, measures it, and returns both the result and the elapsed Duration.
For example, a reporting service logs a warning when the query behind a dashboard takes longer than 500 milliseconds, so the team can find slow reports.
record Timed<T>(T value, Duration took) {}static <T> Timed<T> timed(Supplier<T> task) {
long start = System.nanoTime();
T value = task.get();
return new Timed<>(value, Duration.ofNanos(System.nanoTime() - start));
}Timed<Long> report = timed(() -> sumOfSquares(1_000_000));
long reportValue = report.value(); // 333333833333500000
Duration reportTime = report.took(); // elapsed time of the call, differs per run
boolean warn = report.took().compareTo(Duration.ofMillis(500)) > 0; // false on a normal machineWhen we need to time several steps of one request, a stopwatch class with start, stop and split methods is more convenient, as the article on the Java StopWatch shows.
5. Wall-Clock Time vs CPU Time
The elapsed time from nanoTime() includes everything that happens during the call, such as waiting for a database, garbage collection and other threads that use the CPU. Sometimes we want only the CPU time that the current thread used, for example to tell a slow algorithm from a slow network.
The ThreadMXBean from java.lang.management returns the CPU time of a thread in nanoseconds. It throws an UnsupportedOperationException when the JVM does not support CPU time measurement and returns -1 when the measurement is disabled, so we check the support first.
ThreadMXBean threads = ManagementFactory.getThreadMXBean();
boolean supported = threads.isCurrentThreadCpuTimeSupported();          // true when the JVM can measure CPU time
long cpuStart = threads.getCurrentThreadCpuTime();
long cpuWork = sumOfSquares(2_000_000);
long cpuNanos = threads.getCurrentThreadCpuTime() - cpuStart;         // CPU nanoseconds of this thread, differs per run
6. Benchmarks Need JMH, Not a Timer
A single nanoTime() measurement of a small method says little about its speed. The first calls run in the interpreter until the JIT compiler optimizes the code, the JIT can remove work whose result is never used, and a garbage collection can land in the middle of one run. A comparison of two implementations built on such numbers can point the wrong way.
The Java Microbenchmark Harness (JMH) runs warm-up iterations, forks fresh JVMs, keeps results alive with a Blackhole and reports averages with error margins. We add org.openjdk.jmh:jmh-core and jmh-generator-annprocess, version 1.37, and annotate the method to measure.
@State(Scope.Benchmark)
@BenchmarkMode(Mode.AverageTime)
@OutputTimeUnit(TimeUnit.MICROSECONDS)
public class SumBenchmark {
    @Param({"1000", "100000"})
    int size;

    @Benchmark
    public long sumOfSquares() {
        long sum = 0;
        for (int i = 1; i <= size; i++) {
            sum += (long) i * i;
        }
        return sum;    // returned values are not removed by the JIT
    }
}
The setup steps, the run command and how to read the report are in the JMH tutorial. We keep nanoTime() timings for production logging and timeouts, and JMH for questions like “which of these two methods is faster”.
7. Elapsed Time in Java FAQs
Accuracy and JIT warm-up affect every timing result, even in a Spring Boot app.
7.1. Is System.nanoTime() accurate to one nanosecond?
No. The value is in nanoseconds, but the resolution depends on the hardware and the operating system. Java only promises a resolution at least as good as currentTimeMillis(), so we do not trust single readings of very short operations.
7.2. Can we compare nanoTime() values from two different JVMs?
No. Each JVM picks its own origin, so a nanoTime() value from one process means nothing in another. To compare times across machines or processes, we record Instant timestamps, as in section 3.
7.3. Why is the first measurement slower than the next ones?
The JVM loads classes and runs the code in the interpreter during the first calls, and the JIT compiler optimizes it only after many calls. That is why benchmarks need warm-up iterations, which JMH runs for us.
7.4. How do we measure the execution time of a method in Spring Boot?
For a quick check, we wrap the call in Spring’s StopWatch or in a helper like timed(). For production metrics, we record the time with a Micrometer Timer, which Spring Boot Actuator exports to monitoring systems such as Prometheus.
8. Conclusion
We measure elapsed time in Java with two System.nanoTime() readings and a subtraction, and we turn the result into a Duration to log it in readable units. The wall clock, through currentTimeMillis() or Instant.now(), is for timestamps, and Duration.between() fits times that were stored as instants.
For CPU time, the ThreadMXBean gives the time a thread spent on the processor. For performance comparisons, JMH removes the warm-up and dead-code traps that make single measurements unreliable. The Java date and time guide links the articles on durations, timestamps and stopwatch classes.
9. References
- System.nanoTime() (Java SE 25 API)
- Duration (Java SE 25 API)
- ThreadMXBean (Java SE 25 API)
- OpenJDK JMH on GitHub
Happy Learning !!

hello I am Faisal Seraj. I am a study and i am doing analysis of time complexity of three algorithms Selection , Insertion and Bubble sorting. So i need some check to see how many time each algorithm requires.
hi seraj i am also a study but i check on collection so sorry