
Health checks in any application refer to pre-configured, automated checks for the application’s external dependencies, such as a database, a payment gateway or a vendor system. In a Dropwizard application, the health check feature is implemented by extending the class HealthCheck, and overriding its method check(), which does the actual check and returns the result, whether the external resource is healthy or unhealthy. These checks alert the admins that something broke, rather than application users coming to the support team saying the application is not working.
Dropwizard supports both on-demand and scheduled health checks. To invoke an on-demand health check, we call the /healthcheck URL on the admin port. For scheduled checks, its built-in health module runs the preconfigured checks on a timer in the background, and publishes their results on a second endpoint, /health-check, which is primarily used by load balancers.
The following snippet is a complete database health check.
package com.howtodoinjava.dropwizard.health.health;

import com.codahale.metrics.health.HealthCheck;
import com.howtodoinjava.dropwizard.health.core.InventoryDatabase;

public class DatabaseHealthCheck extends HealthCheck {

    private final InventoryDatabase database;

    public DatabaseHealthCheck(InventoryDatabase database) {
        this.database = database;
    }

    @Override
    protected Result check() {
        if (database.ping()) {
            return Result.healthy();
        }
        return Result.unhealthy("Cannot reach the inventory database");
    }
}
The check never throws an exception for a failure it expects. It returns Result.unhealthy() with a short message, so whoever reads the endpoint knows exactly what went wrong.
This article writes a check like this one for a small order service, reads both health endpoints, configures liveness and readiness in the health block, and tests the checks with JUnit.
1. Health Checks in Dropwizard 5 and Their Two Endpoints
Dropwizard 5 exposes health information at two separate endpoints, and it helps to know both before writing any code. The admin connector, a second web server inside the app meant only for operators, serves /healthcheck. It runs every registered check on every request and returns a JSON report immediately.
The second endpoint comes from Dropwizard’s health module. Since Dropwizard 2.1, this module is bundled directly into dropwizard-core, so adding dropwizard-core as a dependency automatically pulls in the health module too. We do not add it separately. We just add a health block to config.yml, and it runs the checks we pick on a schedule in the background, instead of on every request, publishing their last known result at /health-check on the main application connector.
So /healthcheck runs the checks live, the moment it is called. /health-check does not run checks when called at all, it only reports whatever the background timer last computed. Most production applications keep both endpoints, because each one serves a different caller.
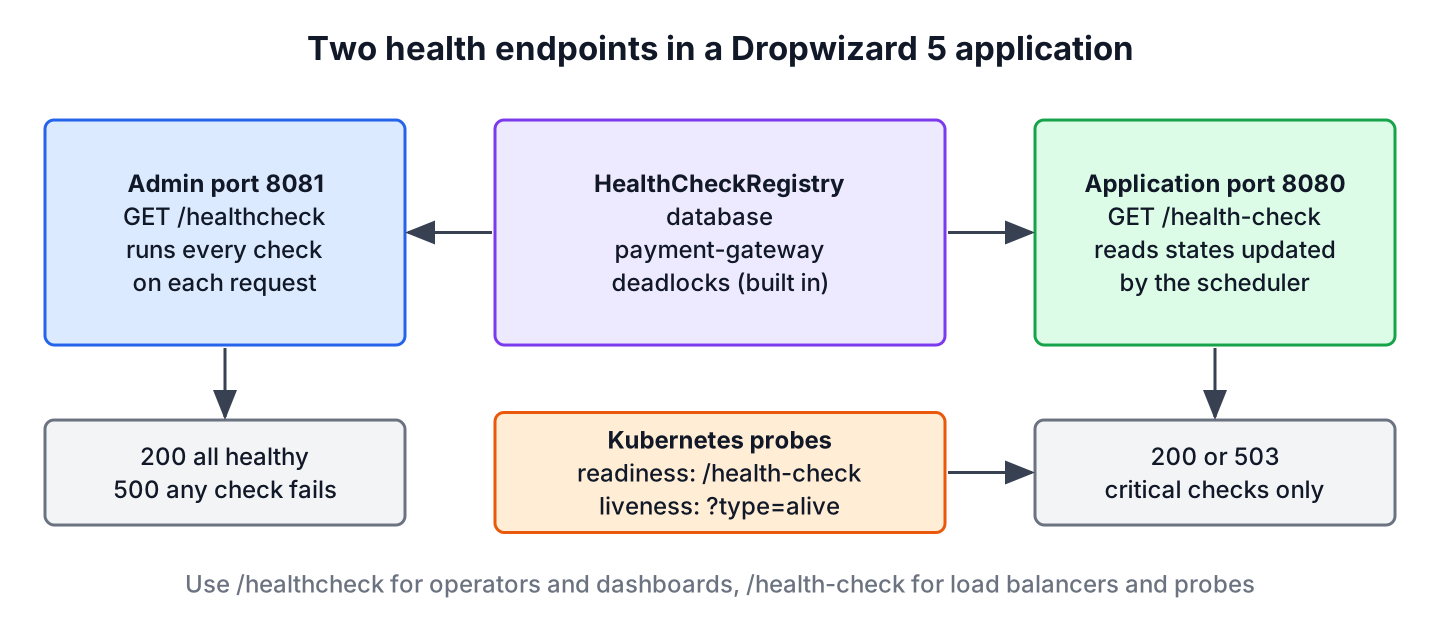
These two endpoints are easy to confuse the first time a project uses both, so it helps to compare their ports and status codes side by side.
| Endpoint | Port (default) | When checks run | Status codes | Typical caller |
|---|---|---|---|---|
| /healthcheck | admin, 8081 | on every request | 200 or 500 | operators, dashboards, alerting |
| /health-check | application, 8080 | on a schedule in the background | 200 or 503 | load balancers, Kubernetes probes |
| /health-check?type=alive | application, 8080 | on a schedule, only alive checks | 200 or 503 | Kubernetes liveness probe |
This example project is a small order service with two dependencies, an inventory database and a payment gateway. It runs on Dropwizard 5.0.2, which bundles Jetty 12.1 and Jersey 3.1, Java 25 and JUnit 6.1.3. Dropwizard 5 requires Java 17 or later. For a Dropwizard introduction, refer to the Dropwizard hello world tutorial, and the Dropwizard tutorials page lists the rest of the series.
2. Writing a Custom HealthCheck Class
Every health check extends HealthCheck and overrides one method, check(). The method returns a HealthCheck.Result, and we do not need to catch our own exceptions inside it, because Dropwizard catches whatever escapes and converts it into an unhealthy result.
A good check tests the real dependency, but as lightly as possible, such as one SELECT 1 query or one request to a status URL. The admin endpoint runs every registered check again on each request, so a slow check slows down /healthcheck itself.
If the payment gateway of the order service goes down during checkout, every order fails, and a health check that calls the gateway status URL reports the outage within seconds, well before any customer complaint reaches the support team.
2.1. Building the Result With a Message and Details
The class Result gives three ways to build an answer. Result.healthy() and Result.unhealthy(message) cover most checks, Result.unhealthy(Throwable) preserves the original exception, and Result.builder() attaches extra fields with withDetail().
The payment gateway check below uses the builder to report how long the call took, and sets a timeout on the HttpClient, so a gateway that hangs cannot block the health check indefinitely. This is also where a real exception gets caught and turned into a short, safe message.
@Override
protected Result check() throws InterruptedException {
    HttpRequest request = HttpRequest.newBuilder(statusUrl)
            .timeout(Duration.ofSeconds(2))
            .GET()
            .build();
    long start = System.nanoTime();
    try {
        HttpResponse<Void> response = client.send(request, HttpResponse.BodyHandlers.discarding());
        long millis = Duration.ofNanos(System.nanoTime() - start).toMillis();

        if (response.statusCode() != 200) {
            return Result.unhealthy("Payment gateway returned HTTP %d", response.statusCode());
        }
        return Result.builder()
                .healthy()
                .withMessage("Payment gateway is up")
                .withDetail("responseTimeMs", millis)
                .build();
    } catch (IOException e) {
        return Result.unhealthy("Payment gateway unreachable: %s", e.getClass().getSimpleName());
    }
}
A failed check message should stay short, and should never carry the full exception or a connection string, because the admin endpoint exposes that message to anyone who can reach the admin port. The message above names only the exception class, which already lets an operator tell a refused connection apart from a timeout.
2.2. Registering the Checks
A health check does nothing on its own until it is registered. Registration happens inside Application.run(), through environment.healthChecks(), which returns the HealthCheckRegistry.
The name passed at registration becomes the key in every JSON report the endpoints return, and the same name is referenced later in the health configuration. The name should stay short and stable, since renaming it later means updating both places.
environment.healthChecks().register("database", new DatabaseHealthCheck(database));
environment.healthChecks().register("payment-gateway",
        new PaymentGatewayHealthCheck(config.getPaymentGatewayUrl()));
Dropwizard always registers one additional check of its own, called deadlocks, which fails when the JVM detects threads stuck waiting on each other. If no check is registered at all, Dropwizard prints a warning at startup.
!    THIS APPLICATION HAS NO HEALTHCHECKS. THIS MEANS YOU WILL NEVER KNOW      !
!     IF IT DIES IN PRODUCTION, WHICH MEANS YOU WILL NEVER KNOW IF YOU'RE      !
!    LETTING YOUR USERS DOWN. YOU SHOULD ADD A HEALTHCHECK FOR EACH OF YOUR    !
!         APPLICATION'S DEPENDENCIES WHICH FULLY (BUT LIGHTLY) TESTS IT.       !
3. Reading /healthcheck on the Admin Port
The admin connector is a second Jetty server inside the app, separate from the one serving the application API, and it listens on port 8081 by default. It serves /healthcheck, /metrics, /ping and the admin tasks. The example binds both connectors to 127.0.0.1, because the admin port must never be exposed to the internet.
server:
  applicationConnectors:
    - type: http
      port: 8080
      bindHost: 127.0.0.1
  adminConnectors:
    - type: http
      port: 8081
      bindHost: 127.0.0.1
The service starts with java -jar target/dropwizard-health-check-1.0.0.jar server config.yml. The parameter pretty=true formats the JSON response for readability.
curl -i 'http://localhost:8081/healthcheck?pretty=true'HTTP/1.1 200 OK
Content-Type: application/json
Cache-Control: must-revalidate,no-cache,no-store
{
"database" : {
"healthy" : true,
"duration" : 0,
"timestamp" : "2026-10-11T21:43:23.386+05:30"
},
"deadlocks" : {
"healthy" : true,
"duration" : 0,
"timestamp" : "2026-10-11T21:43:23.386+05:30"
},
"payment-gateway" : {
"healthy" : true,
"message" : "Payment gateway is up",
"duration" : 125,
"responseTimeMs" : 122,
"timestamp" : "2026-10-11T21:43:23.511+05:30"
}
}The custom responseTimeMs detail appears next to duration, which Dropwizard measures for every check on its own. To simulate a failure, the example project includes an admin task that marks the inventory database unreachable (curl -X POST http://localhost:8081/tasks/database-outage). After that call, the same endpoint returns HTTP 500 with the exact message set in Result.unhealthy().
HTTP/1.1 500 Server Error
Content-Type: application/json

{"database":{"healthy":false,"message":"Cannot reach the inventory database","duration":0,"timestamp":"2026-10-11T21:43:27.665+05:30"},"deadlocks":{"healthy":true,"duration":0,"timestamp":"2026-10-11T21:43:27.665+05:30"},"payment-gateway":{"healthy":true,"message":"Payment gateway is up","duration":13,"responseTimeMs":13,"timestamp":"2026-10-11T21:43:27.679+05:30"}}
A single failed check is enough to turn the entire response into a 500, even for a dependency the application could tolerate losing temporarily. This strictness works well for alerting, but is too strict for a load balancer, which is the gap the health module in the next section addresses.
4. Health Check Configuration in config.yml
The top-level health block decides which registered checks feed /health-check. For each check, it sets whether the check represents readiness or liveness, how often it runs, and whether a failure should take the instance out of service.
A check registered in code but left out of health.healthChecks still appears in /healthcheck, since that endpoint reports every registered check regardless. It has no effect on /health-check, which only evaluates the checks listed in this block.
health:
  delayedShutdownHandlerEnabled: true
  shutdownWaitPeriod: 5s
  healthCheckUrlPaths: ["/health-check"]
  healthChecks:
    - name: deadlocks
      type: alive
      critical: true
    - name: database
      type: ready
      critical: true
      schedule:
        checkInterval: 5s
        downtimeInterval: 2s
        failureAttempts: 1
        successAttempts: 1
    - name: payment-gateway
      type: ready
      critical: false
      schedule:
        checkInterval: 10s
        downtimeInterval: 5s
Each setting comes from the health configuration reference, and the default values matter as much as the ones explicitly set, since any check without its own schedule block uses them.
| Property | Default | What it does |
|---|---|---|
| healthCheckUrlPaths | /health-check | Paths of the endpoint on the application connector. |
| type | ready | A ready check says the instance can take traffic right now; an alive check says the process itself should keep running. |
| critical | false | Only a failed critical check turns the whole endpoint to 503. |
| initialState | true | The state before the first run, so a slow first check does not block startup. |
| schedule.checkInterval | 5s | Time between runs while the check is healthy. |
| schedule.downtimeInterval | 30s | Time between runs while the check is unhealthy. |
| schedule.failureAttempts | 3 | Consecutive failures needed before the state flips to unhealthy. |
| schedule.successAttempts | 2 | Consecutive successes needed before the state flips back to healthy. |
| delayedShutdownHandlerEnabled | false | On shutdown, report unhealthy first and wait shutdownWaitPeriod (default 15s) before Jetty actually stops. |
In the configuration above, the database check is critical and readiness, so it fails after a single bad run, while the payment gateway check is readiness but not critical. When every check passes, the endpoint returns an empty JSON array and reports the actual result through the status code. Adding name=all lists the state of every configured check instead.
curl -i http://localhost:8080/health-check
curl 'http://localhost:8080/health-check?name=all'
HTTP/1.1 200 OK
Cache-Control: no-store
Content-Type: application/json
[]
[{"name":"database","healthy":true,"type":"READY","critical":true},{"name":"deadlocks","healthy":true,"type":"ALIVE","critical":true},{"name":"payment-gateway","healthy":true,"type":"READY","critical":false}]After the database outage task runs, the scheduler detects the failure within one interval, logs it, and flips the endpoint to 503. The liveness view, type=alive, ignores readiness checks entirely, so it continues returning 200.
ERROR [2026-10-11 16:13:26,399] io.dropwizard.health.HealthCheckManager: A critical dependency is now unhealthy: name=database, type=READY
HTTP/1.1 503 Service Unavailable
A failing payment gateway behaves differently, since it is not critical. The check’s state still turns unhealthy, and Dropwizard still logs a warning, but /health-check continues returning 200. The instance stays in the load balancer and keeps serving order lookups, with payments unavailable.
WARN  [2026-10-11 16:14:36,657] io.dropwizard.health.HealthCheckManager: A non-critical dependency is now unhealthy: name=payment-gateway, type=READY
[{"name":"database","healthy":true,"type":"READY","critical":true},{"name":"deadlocks","healthy":true,"type":"ALIVE","critical":true},{"name":"payment-gateway","healthy":false,"type":"READY","critical":false}]
The delayed shutdown handler appears in the log when the service is stopped with Ctrl+C. Dropwizard marks the instance unhealthy first, waits five seconds so the load balancer has time to stop routing requests to it, and only then lets Jetty stop.
INFO  [2026-10-11 16:13:30,776] io.dropwizard.health.HealthCheckManager: delayed shutdown: started (waiting 5 seconds)
INFO  [2026-10-11 16:13:35,777] io.dropwizard.health.HealthCheckManager: delayed shutdown: finished
5. Liveness and Readiness Probes in Kubernetes
Kubernetes restarts a container as soon as its liveness probe fails, and removes the pod from service only when its readiness probe fails. Confusing the two causes restart loops, such as a pod that keeps restarting only because the database behind it is down. The Kubernetes basics article covers pods and deployments for readers new to probes.
The type property set earlier maps directly onto these two probes. The readiness probe points at /health-check and the liveness probe at /health-check?type=alive, so only the deadlocks check can trigger a restart.
livenessProbe:
  httpGet:
    path: /health-check?type=alive
    port: 8080
  periodSeconds: 10
  failureThreshold: 3
readinessProbe:
  httpGet:
    path: /health-check
    port: 8080
  periodSeconds: 5
  failureThreshold: 2
Inside a container, bindHost: 127.0.0.1 must be removed from the application connector, or the kubelet cannot reach the port to run either probe. The admin connector can stay bound to localhost, since neither probe calls it.
6. Returning Health Status From a Custom Resource
Some clients cannot parse a 500 response carrying a JSON body, or require a smaller payload than the full admin report. For these cases, the HealthCheckRegistry is injected into a JAX-RS resource to build the response directly. The method runHealthChecks() runs every check and returns a sorted map of results.
@GET
public Response status() {
    SortedMap<String, HealthCheck.Result> results = registry.runHealthChecks();
    Map<String, String> body = new TreeMap<>();
    results.forEach((name, result) -> body.put(name, result.isHealthy() ? "UP" : "DOWN"));

    boolean allHealthy = results.values().stream().allMatch(HealthCheck.Result::isHealthy);
    int status = allHealthy ? 200 : 503;
    return Response.status(status).entity(body).build();
}
The resource is registered with environment.jersey().register(new StatusResource(environment.healthChecks())). During the database outage, it returns 503 with a short map that carries no messages or timings.
HTTP/1.1 503 Service Unavailable
{"database":"DOWN","deadlocks":"UP","payment-gateway":"UP"}
7. Testing Dropwizard Health Checks
A health check is a plain class, so a unit test calls execute() on it directly and asserts on the returned Result. The method execute() wraps check(), measures the duration, and converts any exception into an unhealthy result, the same way the registry does.
@Test
void unhealthyWhenDatabaseIsDown() {
    database.setReachable(false);

    HealthCheck.Result result = healthCheck.execute();

    assertFalse(result.isHealthy());
    assertEquals("Cannot reach the inventory database", result.getMessage());
}
For an integration test, DropwizardAppExtension from dropwizard-testing starts the whole application on random free ports, set with port: 0 in a separate test-config.yml. The test below overrides the gateway URL with a closed port and verifies that the admin endpoint fails as expected.
static final DropwizardAppExtension<OrderConfiguration> APP = new DropwizardAppExtension<>(
        OrderApplication.class,
        ResourceHelpers.resourceFilePath("test-config.yml"),
        ConfigOverride.config("paymentGatewayUrl", "http://127.0.0.1:1/status"));

@Test
void adminHealthCheckFailsWhenGatewayIsDown() {
    Response response = APP.client()
            .target("http://localhost:%d/healthcheck".formatted(APP.getAdminPort()))
            .request()
            .get();

    assertEquals(500, response.getStatus());
    assertTrue(response.readEntity(String.class).contains("Payment gateway unreachable"));
}
The test class carries @ExtendWith(DropwizardExtensionsSupport.class), which starts the application once before the first test and stops it once after the last. The Dropwizard client article uses the same extension to test outgoing HTTP calls.
8. Dropwizard Health Check FAQs
The two health endpoints and their ports are the part that confuses most teams the first time they set up checks for a Dropwizard service.
8.1. What Is the Difference Between /healthcheck and /health-check?
/healthcheck is the admin servlet. It runs every registered check on every request and answers with 200 or 500 plus a detailed JSON report. /health-check belongs to the health module, lives on the application port, shows the scheduled state of only the checks we configured, and answers with 200 or 503.
8.2. Which Port Does the Dropwizard Health Check Use?
The admin endpoint /healthcheck uses the admin connector, port 8081 by default. The health module endpoint /health-check uses the application connector, port 8080 by default. Both ports can change in the server block of config.yml.
8.3. Can I Disable the Admin Health Check Servlet?
Yes. Set servletEnabled: false under admin.healthChecks in config.yml. The same block also has maxThreads (default 4), which limits how many checks can run in parallel for one request.
8.4. Why Does /health-check Stay Healthy When a Dependency Is Down?
One of three things is usually true. Either the check is not marked critical, or it is missing from health.healthChecks altogether, or it simply has not failed failureAttempts times in a row yet. Calling /health-check?name=all shows us the state, the type and the critical flag of every configured check, which is the fastest way to find out which one it is.
9. Conclusion
A Dropwizard health check is implemented as one class per dependency, extending HealthCheck and overriding check(). It returns Result.healthy() or Result.unhealthy(), sets a timeout on any remote call it makes, and keeps its failure messages short. The admin /healthcheck endpoint runs every check on demand, which suits operators and alerting tools.
For load balancers and Kubernetes, the health block in config.yml is the better fit, since it runs checks on a schedule, separates readiness from liveness, and lets only critical failures take an instance out of service. The Dropwizard basic auth tutorial protects the application endpoints of this same kind of service next.
10. References
- Dropwizard Core Manual, Health Checks
- Dropwizard Configuration Reference, Health
- Metrics Health Checks Manual
- Kubernetes Liveness, Readiness and Startup Probes
Happy Learning !!
