In Java, thread dumps provide a detailed snapshot of an application’s multithreaded environment. Understanding thread dumps is crucial for troubleshooting issues like high CPU utilization, deadlocks, or unresponsive applications.
In this comprehensive guide, we will deep-dive into the intricacies of thread dumps, exploring how to generate, analyze, and interpret them effectively. By the end of this article you will understand all about thread dumps like creating them, analyzing them, an analogy of thread dump files, and many other things, so let’s dive into it.
1. A brief Introduction to Threads in Java
Before we jump into thread dumps, it is recommended to go through the basics of Java threads and thread lifecycle/states so it will be easy for us to understand thread dumps.
A “thread” in a program refers to a distinct path of execution. The JVM provides the capability for an application to run multiple threads concurrently. Each thread is assigned a priority (default is 5), and threads with higher priorities are given preference for execution over threads with lower priorities.
Each thread has a unique identifier, and name, and may be categorized either of the:
- Daemon thread
- Non-daemon thread
A daemon thread runs independently of other threads in the system and is only killed when either the Runtime.exit() method has been called (and the security manager authorizes the exiting of the program) or all non-daemon threads have died.
2. What is a Thread Dump?
A thread dump, also known as a “thread dump snapshot“, is a diagnostic report of the states of all threads that are part of the process/application. In a thread dump, some of the threads belong to the Java application you are running, while others are JVM internal threads.
A thread dump typically includes information about each thread in the application, such as its name, state (e.g., running, waiting, blocked), and priority. It may also show the thread’s stack trace, which is a list of method calls and their current execution points.
Generally, analyzing a thread dump involves examining the state and stack trace of each thread to understand what the threads are doing, what they are waiting for, and which resources they are contending for. This analysis helps pinpoint the root cause of various problems related to concurrency such as:
- Deadlocks: detect a situation where two or more threads are waiting for each other to release a resource. You can see which threads are stuck and what they are waiting for.
- High CPU Usage: identify the threads or code causing high CPU usage. You can see which threads are consuming the most CPU time and what they are doing.
- Long Response Times: pinpoint threads that are blocked or perform time-consuming tasks, leading to long response times in your application.
- Blocked I/O Operations: show which threads are blocked on I/O and the stacktrace for that operation.
- Application Hangs: provide a snapshot of the thread states and their activities, helping you identify the cause of the hang.
3. Setting Up a Demo Program
The following Java program deliberately creates a thread deadlock by having two threads acquire locks in a specific order that guarantees they will block each other. The program will be stuck in this state until it’s forcibly terminated.
public class ThreadDeadlock {

  private static final Object lock1 = new Object();
  private static final Object lock2 = new Object();

  public static void main(String[] args) {

    Thread thread1 = new Thread(() -> {
      synchronized (lock1) {
        System.out.println("Thread1: Holding lock1...");
        try { Thread.sleep(100); } catch (InterruptedException ignored) {}
        System.out.println("Thread1: Waiting for lock2...");
        synchronized (lock2) {
          System.out.println("Thread1: Acquired lock2.");
        }
      }
    });

    Thread thread2 = new Thread(() -> {
      synchronized (lock2) {
        System.out.println("Thread2: Holding lock2...");
        try { Thread.sleep(100); } catch (InterruptedException ignored) {}
        System.out.println("Thread2: Waiting for lock1...");
        synchronized (lock1) {
          System.out.println("Thread2: Acquired lock1.");
        }
      }
    });

    thread1.start();
    thread2.start();

    try {
      thread1.join();
      thread2.join();
    } catch (InterruptedException e) {
      e.printStackTrace();
    }
  }
}
Now, that our demo program is ready, we are ready to create a thread dump of our code and will analyze them in detail.
4. Different Ways To Capture the Thread Dump
There are many ways in which we can create or capture thread dumps, let’s discover some popular tools here.
4.1. Jstack
The jstack is a command-line JDK utility we can use to capture a thread dump. It takes the PID of a process and displays the thread dump in the console. Alternatively, we can redirect its output to a file.
We can use the below command to get thread dumps using jstack.
jstack 2068 > /tmp/threaddump.txtHere, the jstack command creates thread dumps of the given id (2068) and saves the output file (threaddump.txt) in /tmp folder. PID can be different for every process.
4.2. Kill Command
As we mostly know Linux is mostly used when it comes to production deployments and due to security reasons, we only have JRE’s available not JDK, thus we require a command line solution to create thread dumps.
The easiest way to capture a thread dump in Unix-like systems is through the kill command, which we can use to send a signal to a process using the kill() system call. In this use case, we’ll send it the -3 signal.
Using our same PID from earlier examples, let’s take a look at how to use kill to capture a thread dump:
kill -3 2068 > /tmp/threaddump.txt4.3. JProfiler
JProfiler is a professional tool for analyzing what is going on inside a running JVM. You can use it in development, for quality assurance, and for firefighting missions when your production system experiences problems. It’s a GUI tool which makes it easier to use with some clicks.
To create thread dumps using JProfiler we will follow the below steps. Assuming you already have JProfiler installed or running without any error.
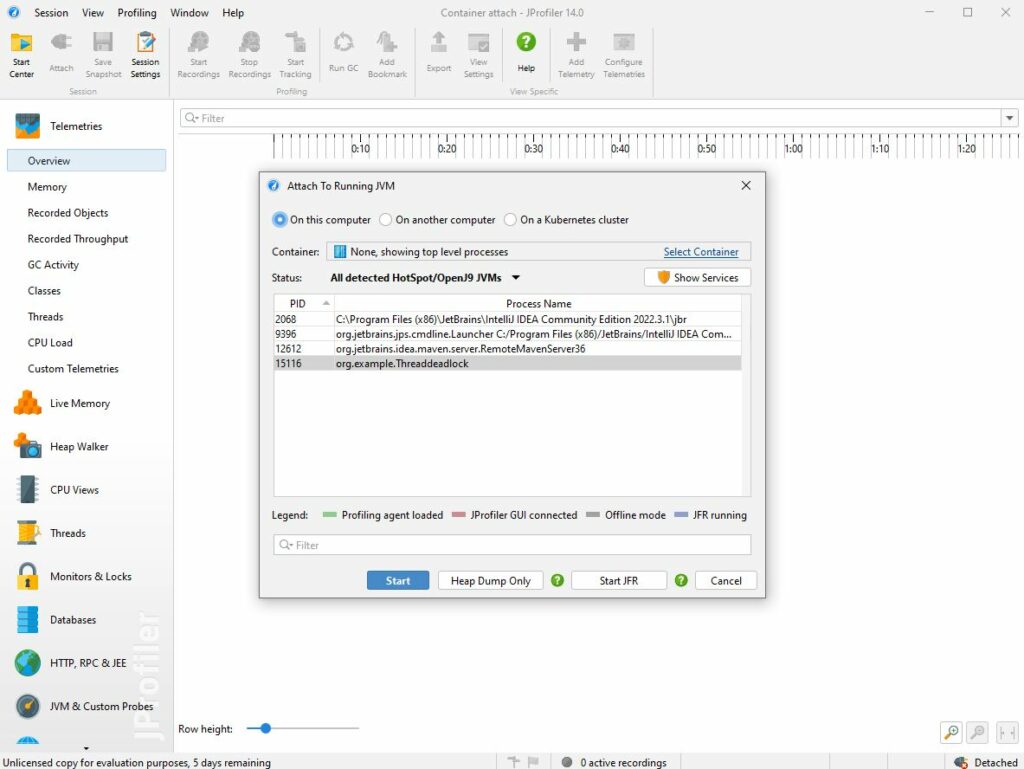
Step 1. Open JProfiler and attach your program by selecting the Attach icon from the main menu as shown below.
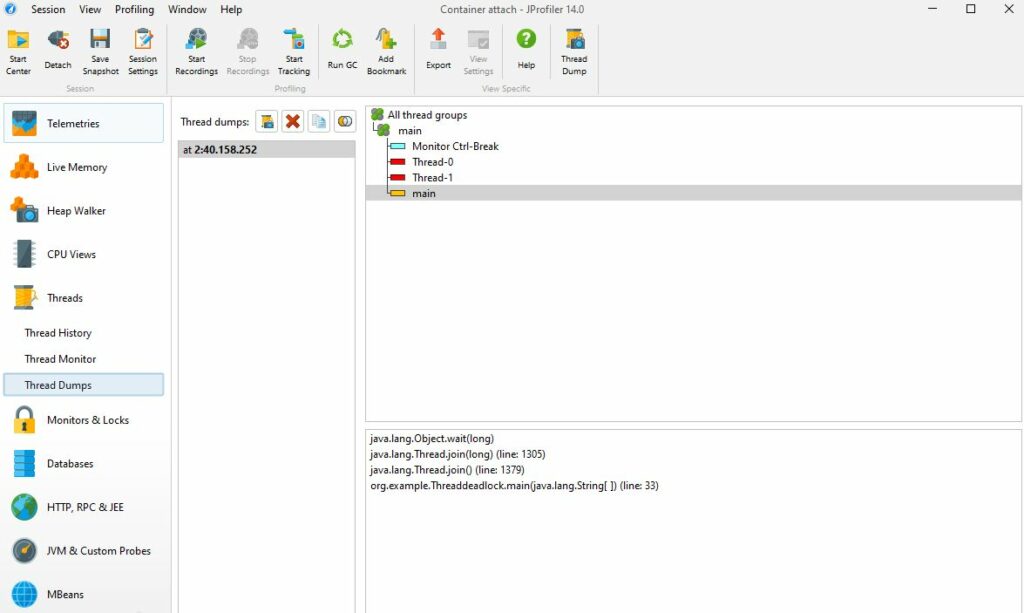
Step 2. Click on the Capture icon under Thread -> Thread Dumps
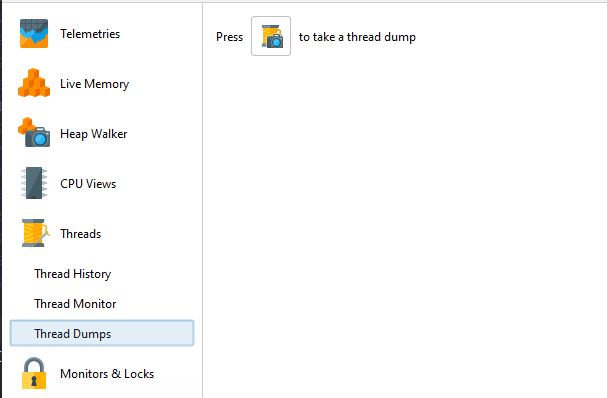
Once you click on capture you will notice that thread dumps are created for the selected PID.
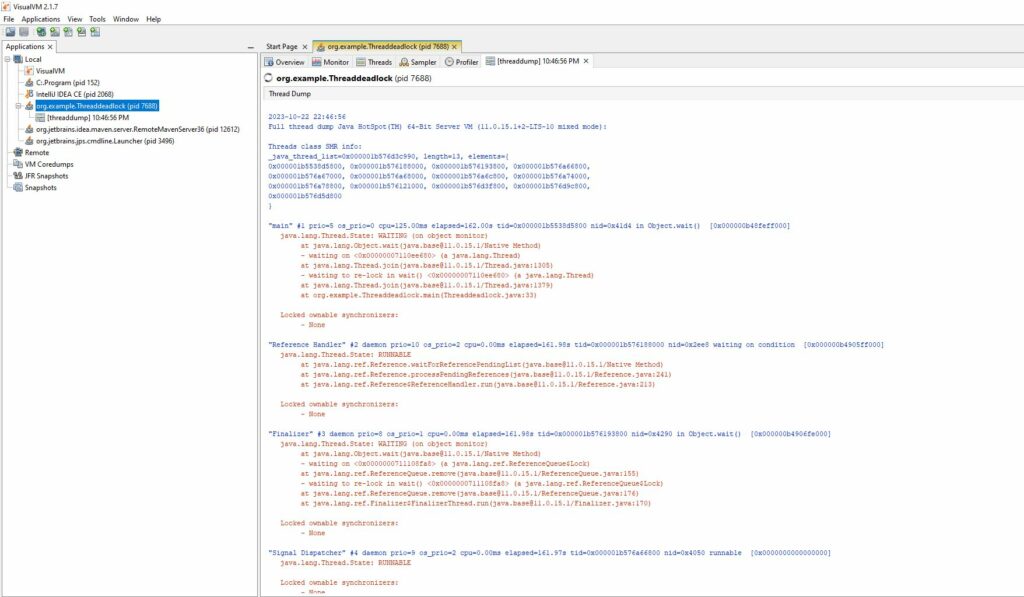
4.4. VisualVM
VisualVM is a powerful tool that provides a visual interface to see deep and detailed information about local and remote Java applications while they are running on a Java Virtual Machine (JVM).
To create or capture Thread Dumps in Visual VM follow the below steps:
Step1. Select the PID that you want to generate thread dumps(all PIDs are shown under the local tab).
Step2. Once you select the PID just right-click and click on thread dump it will generate thread dumps.
5. Understanding the Format and Structure of a Thread Dump File
Till Now we have created a Thread dump file with various methods as discussed above. Now let’s decode the thread dump file and understand it.
To make the thread dump supper easy to understand I have broken down the thread dump file with some sections and will be discussing those.
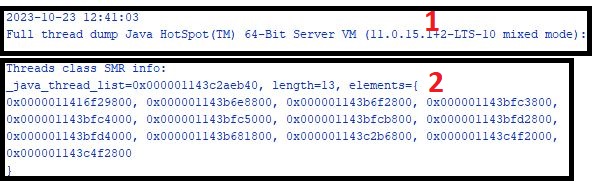
- General Information: This section is found on the top of the file and generally contains the timestamp of the thread dump file when it was created.
- Safe Memory Reclamation (SMR) information: This is the thread list that enumerates the addresses of all non-JVM internal threads (e.g. non-VM and non-Garbage Collection (GC)).
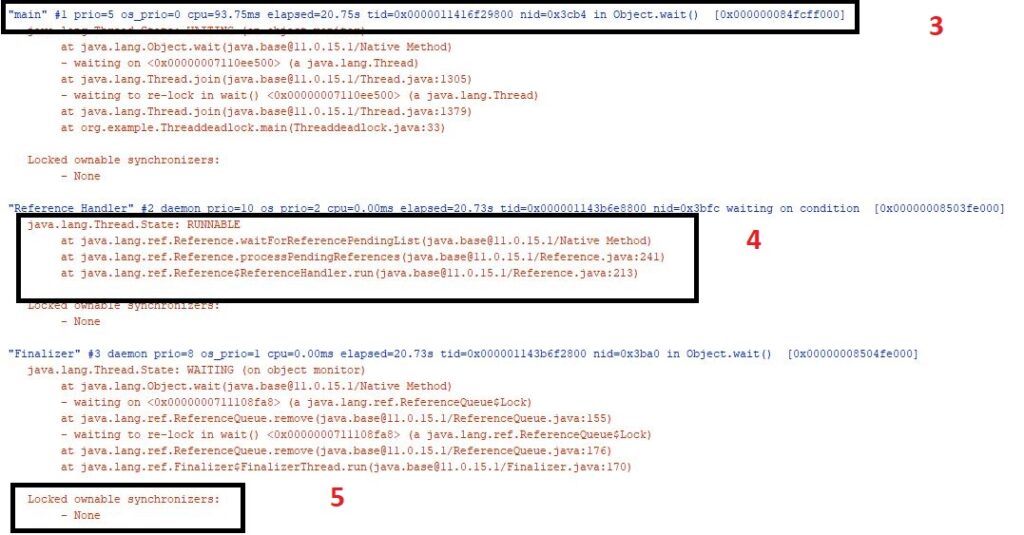
- Threads: After the SMR information we have a list of threads that are captured and these are the main list that we need to analyze for our application. Now let’s take a look at the information that we can extract by looking thread.
Every Thread gives the following information:
- Name: Human-readable name of the thread. This name can be set by calling the
setNamemethod on aThreadobject and be obtained by callinggetNameon the object. - ID: A unique ID associated with each
Threadobject. This number is generated, starting at 1, for all threads in the system. This ID is read-only and can be obtained by callinggetIdon anThreadobject. - Daemon status/Thread Type: A tag denoting if the thread is a daemon thread. If the thread is a daemon, this tag will be present; if the thread is a non-daemon thread, no tag will be present.
- Priority: The numeric priority of the Java thread, However, this does not necessarily correspond to the priority of the OS thread to which the Java thread is dispatched.
- OS Thread Priority: This priority can differ from the Java thread priority and corresponds to the OS thread on which the Java thread is dispatched.
- Address: This address represents the pointer address of the Java Native Interface (JNI) native
Threadobject (the C++Threadobject that backs the Java thread through the JNI). - OS Thread ID: The unique ID of the OS thread to which the Java
Threadis mapped. - Status: A human-readable string depicting the current status of the thread. This string provides information beyond the basic thread state (see below) and can be useful in discovering the intended actions of a thread.
- Name: Human-readable name of the thread. This name can be set by calling the
Hope till now you have a clear idea about thread reading in the thread dump file. Let’s see the below image which clears your doubt if you have any. (See Only point number 3.)
If you still have any questions then comment us. We will be happy to answer your query.
So now move to points 4 and 5 quickly to understand the thread dump file’s format.
- Thread Stack Trace: This is always followed by thread information given in the first line and it provides the last stack tree about the thread which contains very useful information about thread states.
- Locked Ownable Synchronizer: This is the last portion of the thread information containing a list of synchronizers (objects that can be used for synchronization, such as locks) that are exclusively owned by a thread.
All points from 3 to 5 makes a complete thread information which is very useful while analyzing thread dumps
6. JVM Threads: The thread dump contains the JVM-internal (non-application) threads that are bound to the OS. Since these threads do not exist within a Java application, they do not have a thread ID. These threads are usually composed of GC threads and other threads used by the JVM to run and maintain a Java application.
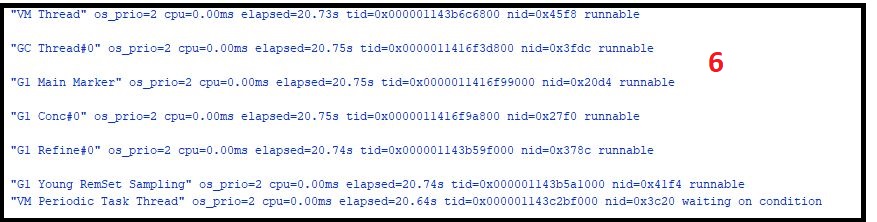
With this, we have broken down the thread dump file and can understand this in a very easy way.
6. Analyzing Java Thread Dumps Manually
So till now, we have created thread dumps and understood how we can read thread dumps files to optimize our focus areas. Let’s dive into diagnosing some of the problems that we discussed earlier in this article.
Here, we are only focusing on below two problems:
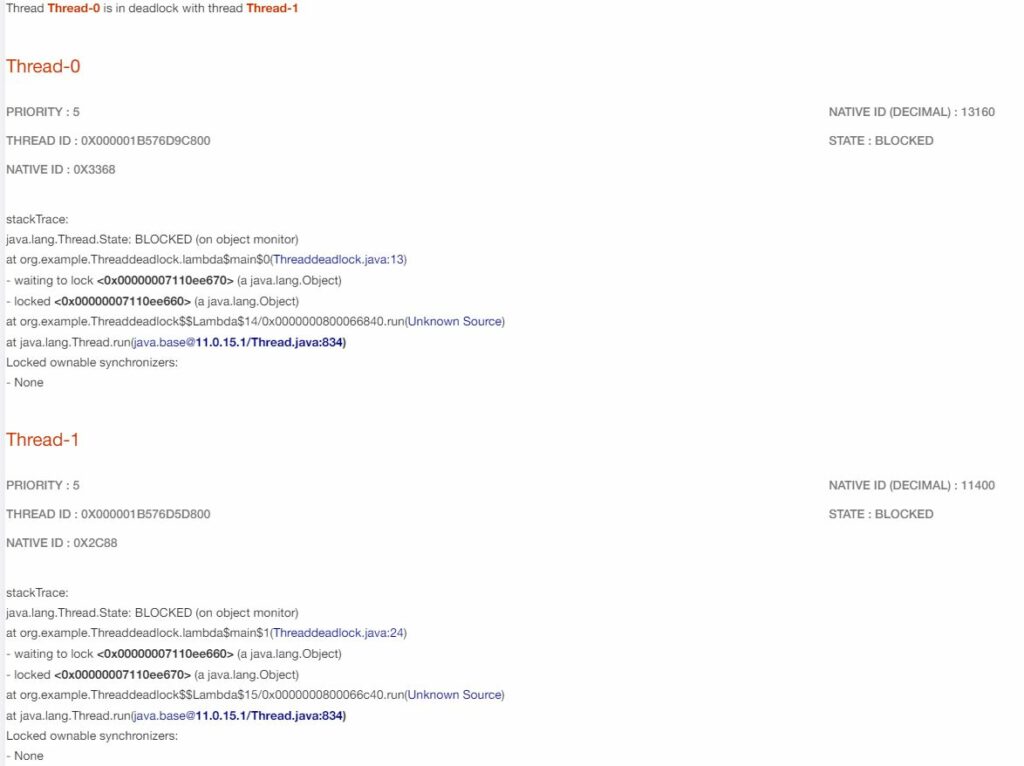
6.1. Identifying the DeadLocks
As we all know, a deadlock occurs when one thread is waiting or blocked for resources that are held by another thread. As we already discussed earlier about thread states, to identify the deadlock situation we will focus on only waiting or blocked thread states and relate them if they are our culprit or not.
"Thread-0" #13 prio=5 os_prio=0 cpu=0.00ms elapsed=161.89s tid=0x000001b576d9c800 nid=0x3368 waiting for monitor entry  [0x000000b4911ff000]
   java.lang.Thread.State: BLOCKED (on object monitor)
        at org.example.Threaddeadlock.lambda$main$0(Threaddeadlock.java:13)
        - waiting to lock <0x00000007110ee670> (a java.lang.Object)
        - locked <0x00000007110ee660> (a java.lang.Object)
        at org.example.Threaddeadlock$$Lambda$14/0x0000000800066840.run(Unknown Source)
        at java.lang.Thread.run(java.base@11.0.15.1/Thread.java:834)

   Locked ownable synchronizers:
        - None

"Thread-1" #14 prio=5 os_prio=0 cpu=0.00ms elapsed=161.89s tid=0x000001b576d5d800 nid=0x2c88 waiting for monitor entry  [0x000000b4912ff000]
   java.lang.Thread.State: BLOCKED (on object monitor)
        at org.example.Threaddeadlock.lambda$main$1(Threaddeadlock.java:24)
        - waiting to lock <0x00000007110ee660> (a java.lang.Object)
        - locked <0x00000007110ee670> (a java.lang.Object)
        at org.example.Threaddeadlock$$Lambda$15/0x0000000800066c40.run(Unknown Source)
        at java.lang.Thread.run(java.base@11.0.15.1/Thread.java:834)

   Locked ownable synchronizers:
        - None
So from the above thread dump snippet, we can see that Thread-0 and Thread-1 are in a ‘BLOCKED‘ state and cannot be freed at this moment thus they are creating a deadlock in our application which affects application performance.
6.2. Identifying the High CPU Utilization
This problem occurs when some of the threads consume high memory or CPU and others are left with low memory which leads to application slowness and impacts user experience. These Threads are always in Runnable states and occupy high CPU memory that can be seen on the thread’s first line as shown in the code snippet below.
"Thread-0" #13 prio=5 os_prio=0 cpu=5187.50ms elapsed=5.24s tid=0x000001cff60f3800 nid=0x4354 runnable  [0x0000009031afe000]
   java.lang.Thread.State: RUNNABLE
        at org.example.ThreadhighCPU.lambda$main$0(ThreadhighCPU.java:10)
        at org.example.ThreadhighCPU$$Lambda$14/0x0000000800066840.run(Unknown Source)
        at java.lang.Thread.run(java.base@11.0.15.1/Thread.java:834)

   Locked ownable synchronizers:
        - None
Have you noticed what we just discussed? You can easily see that the thread is consuming a high CPU (5187.50ms) and its state is Runnable.
Here we have used thread dumps created with our demo program to show to keep things simple for understanding. However in reality we can have a much more complex scenario and can have multiple threads in the thread dump file.
7. Analyzing Java Thread Dumps using Tools
7.1. FastThread.io [Paid Tool]
To deal with complex thread dumps we can use some thread Analyzer tools. In the Market, we have many tools for TDA, however, we are going to discuss ‘Fast Thread‘ one of the best online tools to analyze thread dumps in real-time.
Fast Thread is a fine thread dump analyzer, having all the basic features required to analyze a simple as well as a complex thread dump. It is an online open-source tool and can be accessed via URL. It is mainly used for performance engineering to find out the exact root cause of the issue, produced by Java Thread.
We can follow the below steps to generate a thread dump report from FastThread.
Step 1. Launch fastThread using the URL: http://fastthread.io/
Step 2. Create your account with a free plan (See the Pricing section as per your need.)
Step 3. Once the account is created. Upload the thread dump file and hit the analyze button.

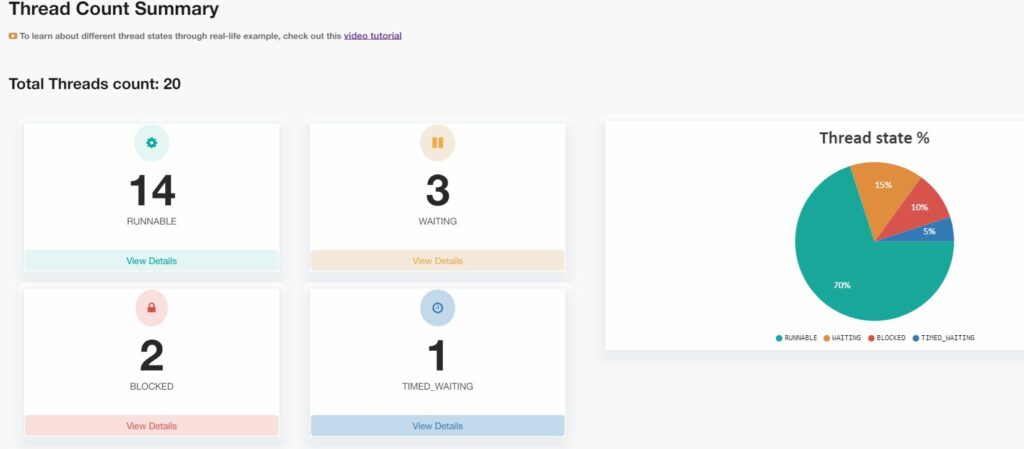
Once the report is complete it will show you the complete report and from that, you can easily take the next step.
Some of the screen snippets from the fast thread report.
7.2. VisualVM [Free Tool]
Now, Let’s discuss another tool for thread thumps analysis i.e. VisualVM.
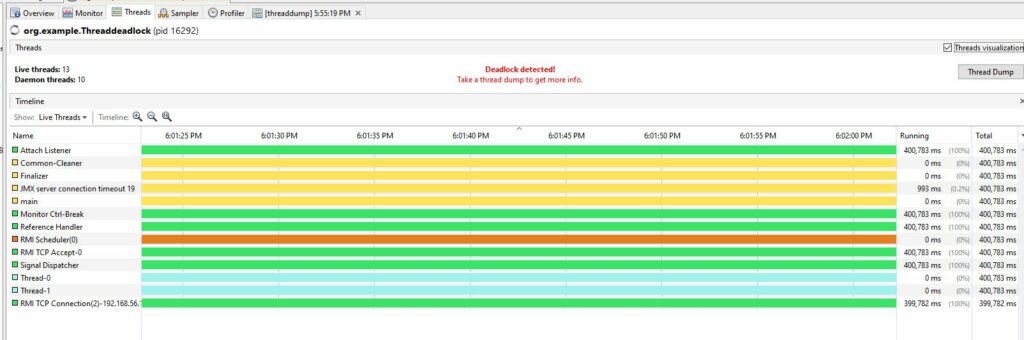
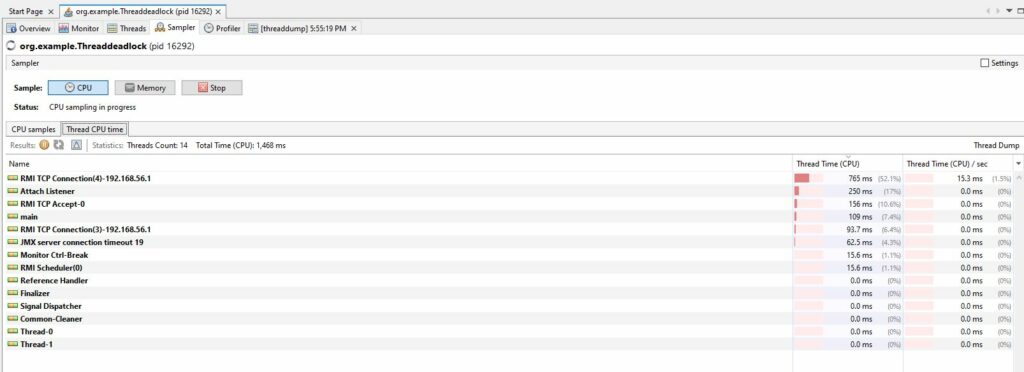
With VisualVM, you can effortlessly visualize thread states, review stack traces, and identify issues such as high CPU usage, thread contention, and deadlocks. It also enables you to monitor the memory usage and garbage collection activity of your application, providing a holistic view of its performance.
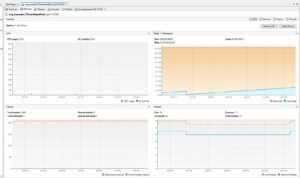
Some of the screenshots of VisualVM.

Till now we have covered almost everything about thread dumps like how they are created, how we read them, and how to deal with manually and with automated tools.
8. Comparing Tools for Thread Dump Analysis
Now, let’s compare the Tools and methods that we have used till now in this article based on their Pros and Cons.
| Tools | Pros | Cons |
|---|---|---|
| Jstack | Included with the JDK, so readily available. Easy to use and run from the command line. Works on any platform that supports Java. | Limited in features compared to some third-party tools. Requires manual execution when a problem occurs. |
| VisualVM | Comes with the JDK, so it’s available without extra installation. Offers a user-friendly GUI for monitoring and capturing thread dumps. Provides other performance analysis features, including heap dumps and profiling. | May require some setup to connect to the target application. |
| kill -3 | Simple and quick method for capturing thread dumps on Unix/Linux-based systems | Only available on Unix-based systems. Provides thread dumps for the entire Java process, not a specific Java application |
| JProfiler | Advanced profiling capabilities, including thread dump capture. Can provide detailed insights into thread activities and performance bottlenecks. | Commercial tools that require a license. Overkill for basic thread dump capture needs |
| FastThread | Open-source tool for analyzing thread dumps. Provides a graphical representation of thread activity for easier analysis. Allows you to filter, search, and navigate through thread dumps efficiently. | Requires a paid license, if you have more than 5 thread dumps in a month. |
| Thread Dump Analyzer | Open-source tool for analyzing thread dumps. Provides a graphical representation of thread activity for easier analysis. Allows you to filter, search, and navigate through thread dumps efficiently. | Requires installation and familiarity with the tool. |
Hope this comparison clears your mind when to use what tools for reading thread dumps.
9. Best Practices
Now, let’s discuss some of the best practices while taking or reading thread dumps.
- Collect Thread Dumps Carefully: Capture thread dumps during periods of performance issues or when you suspect threading problems. No use in capturing dumps when there is no issue or time elapsed.
- Use Thread Dump Analysis Tools: Consider using specialized thread dump analysis tools like Thread Dump Analyzer (TDA), FastThread (if available), or other similar tools for more efficient and comprehensive analysis.
- Visualize Thread States: Most analysis tools provide visual representations of thread states. Understanding thread states is a fundamental part of analysis.
- Examine Thread Stack Traces: Focus on the methods and code sections where threads are spending a significant amount of time.
- Aggregate and Summarize Data: Aggregate thread-related data, such as thread counts and states, to get an overview of the application’s threading behavior.
- Monitor Over Time: Collect and analyze multiple thread dumps over time to identify recurring patterns or trends in your application’s threading behavior.
- Document Findings and Recommendations: Document your analysis, findings, and recommendations for addressing issues. This documentation will be helpful when communicating with your team or management. This is the core part to avoid duplication of issues.
Remember that thread dump analysis can be complex, and a deep understanding of your application’s architecture and the Java Virtual Machine is often required for effective diagnosis and problem resolution. It’s essential to keep learning and adapting your analysis techniques to address specific challenges in your environment.
10. Conclusion
In conclusion, analyzing thread dumps is a vital skill for diagnosing performance issues and threading problems in Java applications. By carefully collecting thread dumps during problematic periods and using specialized analysis tools, you can gain deep insights into your application’s threading behavior.
Leveraging the information in this article, you can take targeted actions to resolve performance bottlenecks and threading issues. Remember that successful thread dump analysis is an ongoing process, and continuous improvement in this skill is key to maintaining the health and efficiency of your Java applications.
Happy Learning !!