With use of microservices, we have been able to overcome many legacy problems and it allow us to create stable distributed applications with desired control on the code, team size, maintenance, release cycle, cloud ennoblement etc. But it has also introduced few challenges in other areas e.g. distributed log management and ability to view logs of full transaction distributed among many services and distributed debugging in general.
Actually the challenge is that microservices are isolated among themselves and they does not share common database and log files. As the number of microservice increases and we enable cloud deployment with automated continuous integration tools, it is very much necessary to have some provision of debugging the components when we have any problem.
Thanks to the open source movement. We already have bundle of tools which can do the magic if used properly together. One such popular set of tools are Elastic Search, Logstash and Kibana – together referred as ELK stack. They are used for searching, analyzing, and visualizing log data in a real time.
In this ELK stack tutorial, learn to integrate ELK stack to microservices ecosystem.
Table of Contents

1. ELK Stack
2. ELK Configuration
3. Create Microservice
4. Logstash Configuration
5. Kibana Configuration
6. Verify ELK Stack
7. Summary
1. What is ELK Stack
- Elasticsearch is a distributed, JSON-based search and analytics engine designed for horizontal scalability, maximum reliability, and easy management.
- Logstash is a dynamic data collection pipeline with an extensible plugin ecosystem and strong Elasticsearch synergy.
- Kibana gives the visualization of data through a UI.
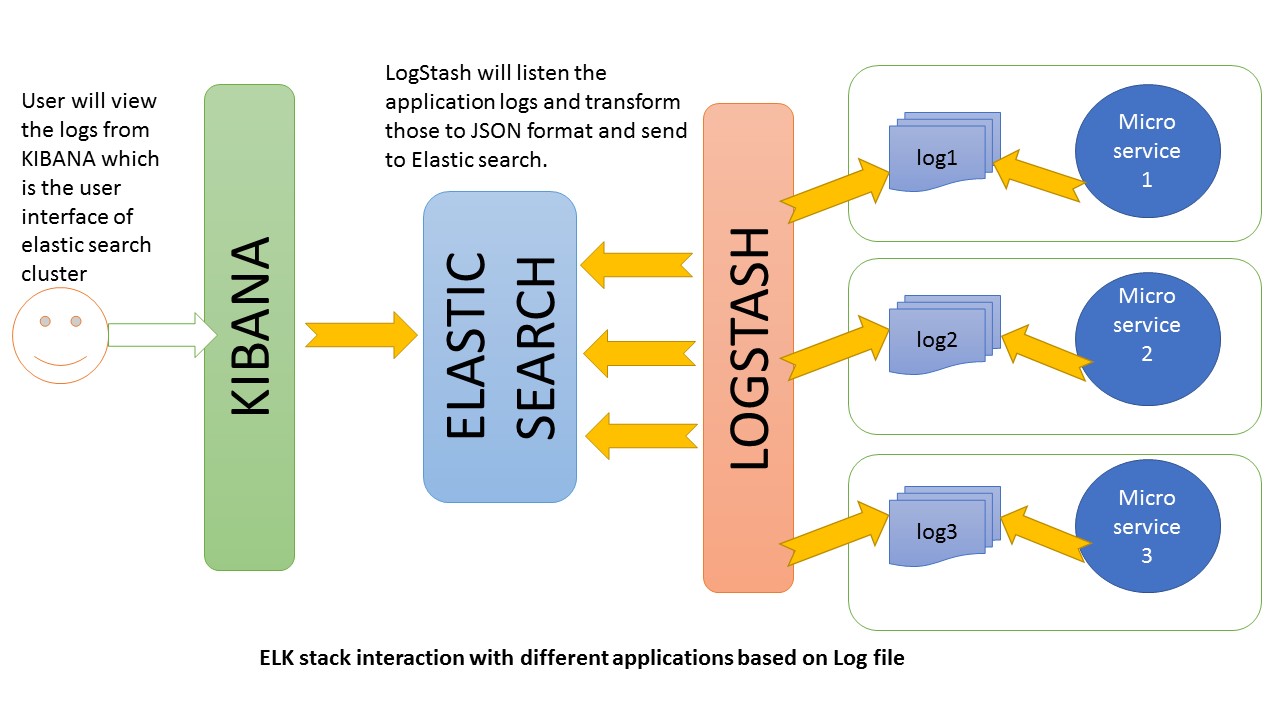
1.1. ELK Stack Architecture
Logstash processes the application log files based on the filter criteria we set and sends those logs to Elasticsearch. Through Kibana, we view and analyze those logs when required.

2. ELK stack configuration
All these three tools are based on JVM and before start installing them, please verify that JDK has been properly configured. Check that standard JDK 1.8 installation, JAVA_HOME and PATH set up is already done.
2.1. Elasticsearch
- Download latest version of Elasticsearch from this download page and unzip it any folder.
- Run
bin\elasticsearch.batfrom command prompt. - By default, it would start at http://localhost:9200
2.2. Kibana
- Download the latest distribution from download page and unzip into any folder.
- Open
config/kibana.ymlin an editor and setelasticsearch.urlto point at your Elasticsearch instance. In our case as we will use the local instance just uncommentelasticsearch.url: "http://localhost:9200" - Run
bin\kibana.batfrom command prompt. - Once started successfully, Kibana will start on default port
5601and Kibana UI will be available at http://localhost:5601
2.3. Logstash
- Download the latest distribution from download page and unzip into any folder.
- Create one file
logstash.confas per configuration instructions. We will again come to this point during actual demo time for exact configuration.Now run
bin/logstash -f logstash.confto start logstash
ELK stack is not up and running. Now we need to create few microservices and point logstash to the API log path.
3. ELK stack example – Create Microservice
3.1. Create Spring Boot Project
Let’s create an application using spring boot for faster development time. Follow those steps to start this service.
3.2. Add REST Endpoints
Add one RestController class which will expose few endpoints like /elk, /elkdemo, /exception. Actually we are going to test few log statements only, so feel free to add/modify logs as per your choice.
package com.example.howtodoinjava.elkexamplespringboot;

import java.io.PrintWriter;
import java.io.StringWriter;
import java.util.Date;

import org.apache.log4j.Level;
import org.apache.log4j.Logger;
import org.springframework.beans.factory.annotation.Autowired;
import org.springframework.boot.SpringApplication;
import org.springframework.boot.autoconfigure.SpringBootApplication;
import org.springframework.context.annotation.Bean;
import org.springframework.core.ParameterizedTypeReference;
import org.springframework.http.HttpMethod;
import org.springframework.web.bind.annotation.RequestMapping;
import org.springframework.web.bind.annotation.RestController;
import org.springframework.web.client.RestTemplate;

@SpringBootApplication
public class ElkExampleSpringBootApplication {

	public static void main(String[] args) {
		SpringApplication.run(ElkExampleSpringBootApplication.class, args);
	}
}

@RestController
class ELKController {
	private static final Logger LOG = Logger.getLogger(ELKController.class.getName());

	@Autowired
	RestTemplate restTemplete;

	@Bean
	RestTemplate restTemplate() {
		return new RestTemplate();
	}

	@RequestMapping(value = "/elkdemo")
	public String helloWorld() {
		String response = "Hello user ! " + new Date();
		LOG.log(Level.INFO, "/elkdemo - > " + response);

		return response;
	}

	@RequestMapping(value = "/elk")
	public String helloWorld1() {

		String response = restTemplete.exchange("http://localhost:8080/elkdemo", HttpMethod.GET, null, new ParameterizedTypeReference() {
		}).getBody();
		LOG.log(Level.INFO, "/elk - > " + response);

		try {
			String exceptionrsp = restTemplete.exchange("http://localhost:8080/exception", HttpMethod.GET, null, new ParameterizedTypeReference() {
			}).getBody();
			LOG.log(Level.INFO, "/elk trying to print exception - > " + exceptionrsp);
			response = response + " === " + exceptionrsp;
		} catch (Exception e) {
			// exception should not reach here. Really bad practice :)
		}

		return response;
	}

	@RequestMapping(value = "/exception")
	public String exception() {
		String rsp = "";
		try {
			int i = 1 / 0;
			// should get exception
		} catch (Exception e) {
			e.printStackTrace();
			LOG.error(e);

			StringWriter sw = new StringWriter();
			PrintWriter pw = new PrintWriter(sw);
			e.printStackTrace(pw);
			String sStackTrace = sw.toString(); // stack trace as a string
			LOG.error("Exception As String :: - > "+sStackTrace);

			rsp = sStackTrace;
		}

		return rsp;
	}
}
3.3. Configure Spring boot Logging
Open application.properties under resources folder and add below configuration entries.
logging.file=elk-example.log
spring.application.name = elk-example
Read More: Spring Boot Logging Example
3.4. Verify Microservice Generated Logs
Do a final maven build using mvn clean install and start the application using command java -jar target\elk-example-spring-boot-0.0.1-SNAPSHOT.jar and test by browsing http://localhost:8080/elk.
Don’t be afraid by seeing the big stack trace in the screen as it has been done intentionally to see how ELK handles exception message.
Go to the application root directory and verify that the log file i.e. elk-example.log has been created and do a couple of visits to the endpoints and verify that logs are getting added in the log file.
4. Logstash Configuration
We need to create a logstash configuration file so that it listen to the log file and push log messages to elastic search. Here is the logstash configuration used in the example, please change the log path as per your setup.
input {
  file {
    type => "java"
    path => "F:/Study/eclipse_workspace_mars/elk-example-spring-boot/elk-example.log"
    codec => multiline {
      pattern => "^%{YEAR}-%{MONTHNUM}-%{MONTHDAY} %{TIME}.*"
      negate => "true"
      what => "previous"
    }
  }
}

filter {
  #If log line contains tab character followed by 'at' then we will tag that entry as stacktrace
  if [message] =~ "\tat" {
    grok {
      match => ["message", "^(\tat)"]
      add_tag => ["stacktrace"]
    }
  }

 grok {
    match => [ "message",
               "(?<timestamp>%{YEAR}-%{MONTHNUM}-%{MONTHDAY} %{TIME})  %{LOGLEVEL:level} %{NUMBER:pid} --- \[(?<thread>[A-Za-z0-9-]+)\] [A-Za-z0-9.]*\.(?<class>[A-Za-z0-9#_]+)\s*:\s+(?<logmessage>.*)",
               "message",
               "(?<timestamp>%{YEAR}-%{MONTHNUM}-%{MONTHDAY} %{TIME})  %{LOGLEVEL:level} %{NUMBER:pid} --- .+? :\s+(?<logmessage>.*)"
             ]
  }


  date {
    match => [ "timestamp" , "yyyy-MM-dd HH:mm:ss.SSS" ]
  }
}

output {

  stdout {
    codec => rubydebug
  }

  # Sending properly parsed log events to elasticsearch
  elasticsearch {
    hosts => ["localhost:9200"]
  }
}
5. Kibana Configuration
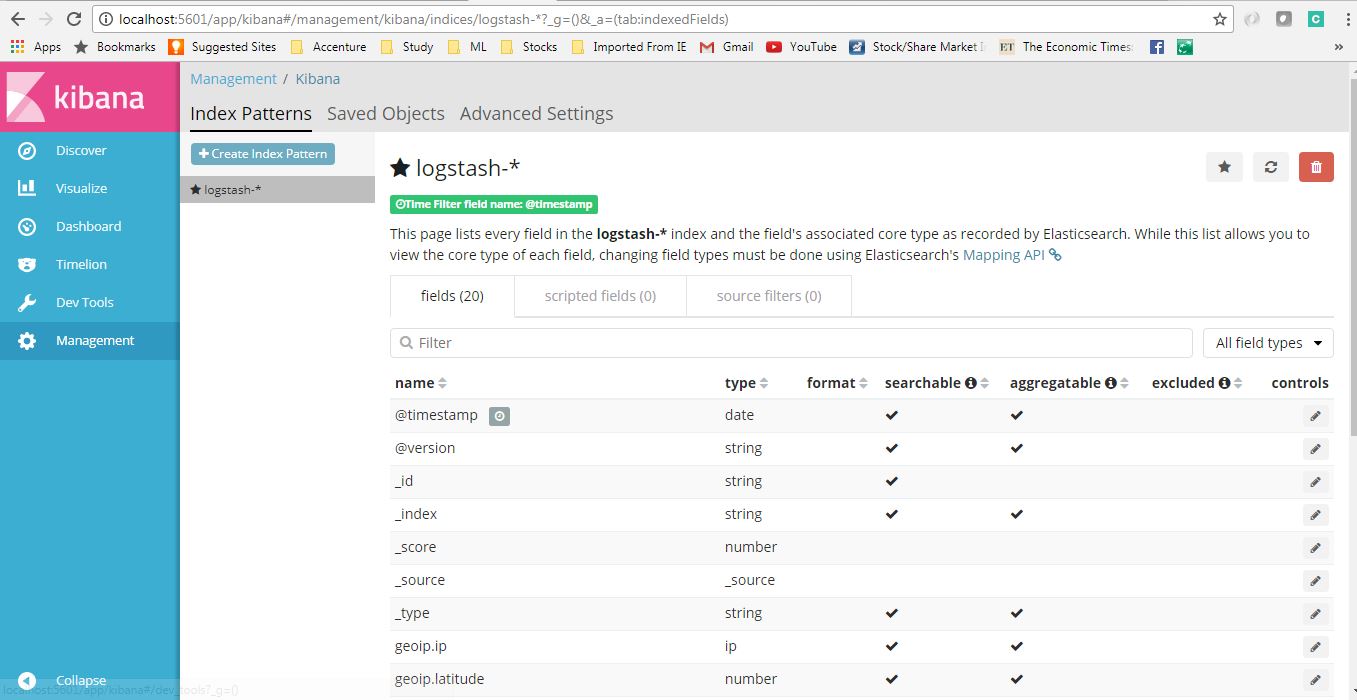
Before viewing the logs in Kibana, we need to configure the Index Patterns. We can configure logstash-* as default configuration. We can always change this index pattern in logstash side and configure in Kibana. For simplicity, we will work with default configuration.
The index pattern management page will look like below. With this configuration we are pointing Kibana to Elasticsearch index(s) of your choice. Logstash creates indices with the name pattern of logstash-YYYY.MM.DD We can do all those configuration in Kibana console http://localhost:5601/app/kibana and going to Management link in left panel.
6. Verify ELK Stack
Now when all components are up and running, let’s verify the whole ecosystem.
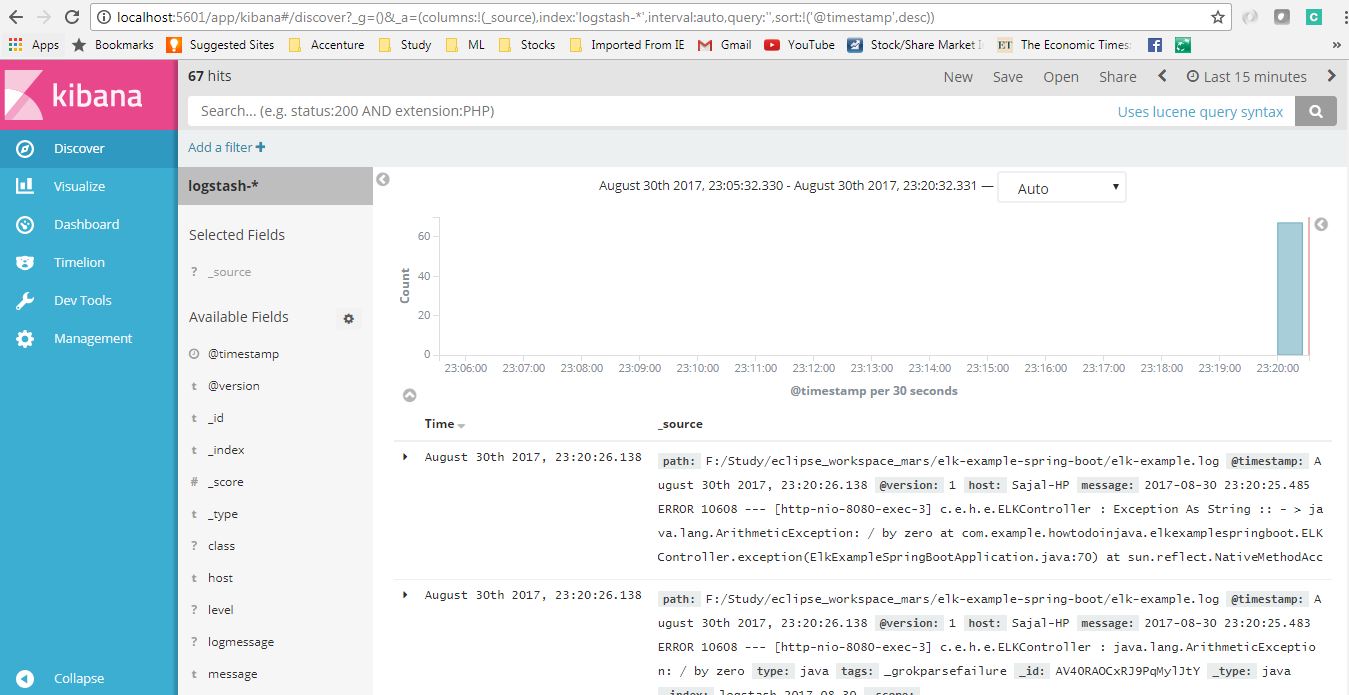
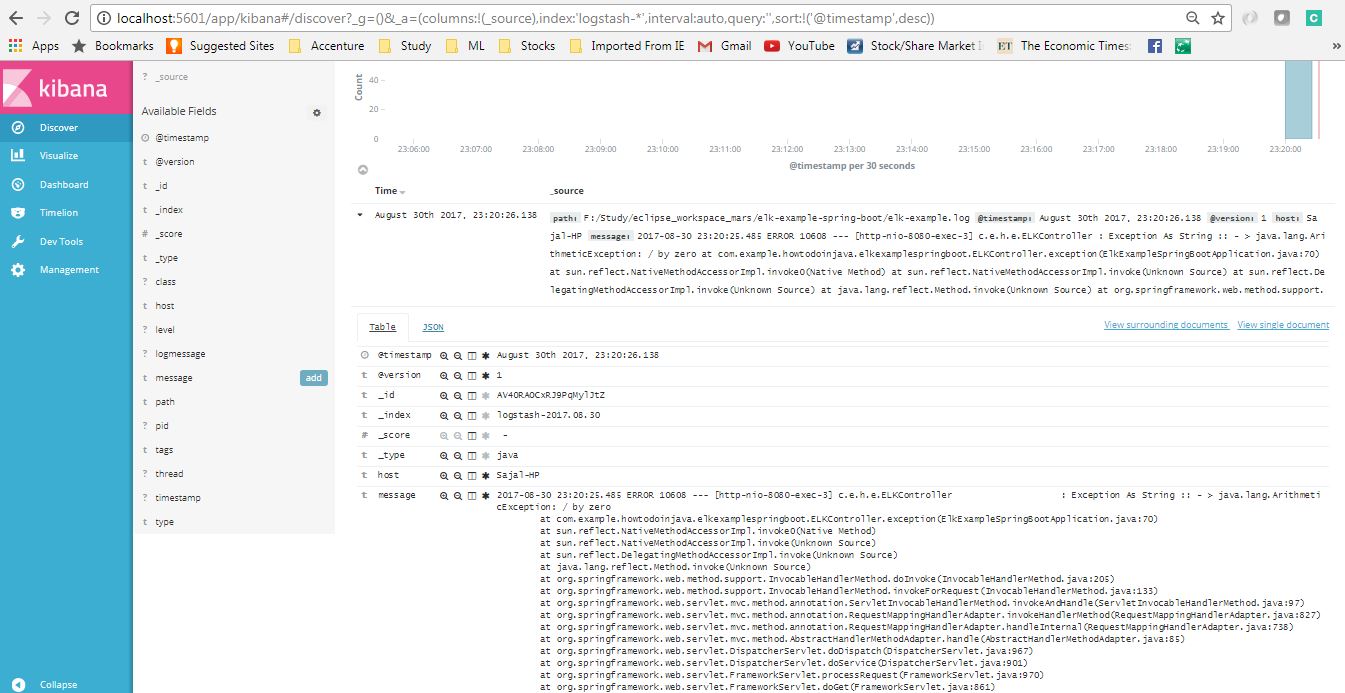
Go to application and test the end points couple of times so that logs got generated and then go to Kibana console and see that logs are properly stacked in the Kibana with lots of extra feature like we can filter, see different graphs etc in built.
Here is the view of generated logs in Kibana.
7. ELK Stack Tutorial – Summary
In this ELK example, we learned to configure ELK stack and the saw how we can point our application log files to ELK and view and analyze logs in Kibana. I will suggest you to play with configurations and share your learnings with us. e.g.
- Instead logstash to listen to our logs, we can use logback configuration to use TCP appender to send logs to a remote Logstash instance via TCP protocol.
- We can point multiple log files with Logstash.
- We can use more sophisticated filters in the logstash configuration file to do more as per our need.
- We can use remote ELK cluster to point to our log files, or push logs into, this is basically required when all the applications will be deployed in cloud.
- Create different index patterns in logstash.
Drop me your questions in comments section.
Happy Learning !!
Comments