Zipkin is a very efficient tool for distributed tracing in the microservices ecosystem. Distributed tracing, in general, is the latency measurement of each component in a distributed transaction where multiple microservices are invoked to serve a single business usecase.
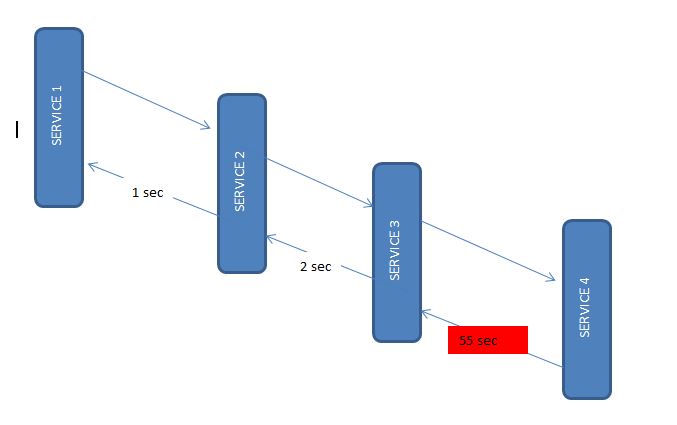
Let’s say from our application, we have to call 4 different services/components for a transaction. Herewith distributed tracing enabled, we can measure which component took how much time.
Distributed tracing is useful during debugging when lots of underlying systems are involved and the application becomes slow in any particular situation. In such cases, we first need to identify which underlying service is actually slow. Once the slow service is identified, we can work to fix that issue. Distributed tracing helps in identifying that slow component in the ecosystem.
1. Zipkin
Zipkin was originally developed at Twitter, based on a concept of a Google paper that described Google’s internally-built distributed app debugger – dapper. It manages both the collection and lookup of this data. To use Zipkin, applications are instrumented to report timing data to it.
If you are troubleshooting latency problems or errors in an ecosystem, you can filter or sort all traces based on the application, length of trace, annotation, or timestamp. By analyzing these traces, you can decide which components are not performing as per expectations, and you can fix them.
Internally it has 4 modules –
- Collector – Once any component sends the trace data, it arrives to Zipkin collector daemon. Here the trace data is validated, stored, and indexed for lookups by the Zipkin collector.
- Storage – This module store and index the lookup data in backend. Cassandra, ElasticSearch and MySQL are supported.
- Search – This module provides a simple JSON API for finding and retrieving traces stored in backend. The primary consumer of this API is the Web UI.
- Web UI – A very nice UI interface for viewing traces.
1.1. Installing Zipkin
Detailed installation steps can be found for different operating systems including the Docker image on the quickstart page. For windows installation, just download the latest Zipkin server from the maven repository and run the executable jar file using the below command.
java -jar zipkin-server-1.30.3-exec.jarOnce Zipkin is started, we can see the Web UI at http://localhost:9411/zipkin/.
The above command will start the Zipkin server with the default configuration. For advanced configuration, we can configure many other things like storage, collector listeners etc.
To install Zipkin in the spring boot application, we need to add Zipkin starter dependency.
<dependency>
    <groupId>org.springframework.cloud</groupId>
    <artifactId>spring-cloud-starter-zipkin</artifactId>
</dependency>
2. Sleuth
Sleuth is another tool from the Spring cloud family. It is used to generate the trace id, span id and add this information to the service calls in the headers and MDC, so that It can be used by tools like Zipkin and ELK etc. to store, index and process log files.
As it is from the spring cloud family, once added to the CLASSPATH, it automatically integrated to the common communication channels like –
- requests made with the RestTemplate etc.
- requests that pass through a Netflix Zuul microproxy
- HTTP headers received at Spring MVC controllers
- requests over messaging technologies like Apache Kafka or RabbitMQ etc.
Using Sleuth is very easy. We just need to add it’s started pom in the spring boot project. It will add the Sleuth to the project and so in its runtime.
<dependency>
    <groupId>org.springframework.cloud</groupId>
    <artifactId>spring-cloud-starter-sleuth</artifactId>
</dependency>
So far we have integrated Zipkin and Sleuth to microservices and ran the Zipkin server. Let’s see how to utilize this setup.
3. Zipkin and Sleuth Integration
For this demo, let us create 4 spring boot based microservices. They all will have both Zipkin and Sleuth starter dependencies.
In each microservice, we will expose one endpoint and from the first service we will call the second service, and from the second service, we will invoke the third and so on using the RestTemplate.

And as we have already mentioned, Sleuth works automatically with resttemplate so it would send this instrumented service call information to the attached Zipkin server. Zipkin will then start the book keeping of latency calculation along with a few other statistics like service call details.
3.1. Creating Microservices
All four services will have the same configuration, the only difference is the service invocation details where the endpoint changes. Let’s create Spring boot applications with Web, Rest Repository, Zipkin and Sleuth dependencies.
I have packaged those services inside a parent project so that those four services can be built together to save time. You can proceed with individual setup if you wish to. Also, I have added useful windows scripts to start/stop all the services with a single command.
This is one sample rest controller which exposes one endpoint and also invokes one downstream service using the RestTemplate. Also, we are using Sampler.ALWAYS_SAMPLE that traces each action.
package com.example.zipkinservice1;

import brave.sampler.Sampler;
import org.apache.log4j.Logger;
import org.springframework.beans.factory.annotation.Autowired;
import org.springframework.boot.SpringApplication;
import org.springframework.boot.autoconfigure.SpringBootApplication;
import org.springframework.context.annotation.Bean;
import org.springframework.core.ParameterizedTypeReference;
import org.springframework.http.HttpMethod;
import org.springframework.web.bind.annotation.GetMapping;
import org.springframework.web.bind.annotation.RestController;
import org.springframework.web.client.RestTemplate;

@SpringBootApplication
public class ZipkinService1Application {

    public static void main(String[] args) {
        SpringApplication.run(ZipkinService1Application.class, args);
    }
}

@RestController
class ZipkinController {

    private static final Logger LOG = Logger.getLogger(ZipkinController.class.getName());

    @Autowired
    RestTemplate restTemplate;

    @Bean
    public RestTemplate getRestTemplate() {
        return new RestTemplate();
    }

    @Bean
    public Sampler alwaysSampler() {
        return Sampler.ALWAYS_SAMPLE;
    }

    @GetMapping(value="/zipkin")
    public String zipkinService1()
    {
        LOG.info("Inside zipkinService 1..");

         String response = (String) restTemplate.exchange("http://localhost:8082/zipkin2",
                                                            HttpMethod.GET,
                                                            null,
                                                            new ParameterizedTypeReference<String>() {})
                                                .getBody();
        return "Hi...";
    }
}
3.2. Appication Configuration
As all services will run in a single machine, so we need to run them in different ports. Also to identify in Zipkin, we need to give proper names. so configure THE application name and port information in application.properties file under the resources folder.
server.port = 8081
spring.application.name = zipkin-server1
Similarly, for the other 3 services, we will use ports 8082, 8083, 8084 and their name will also be zipkin-server2, zipkin-server3 and zipkin-server4.
Also, we have intentionally introduced a delay in the last service so that we can view that in Zipkin.
4. Demo
Do a final maven build using command mvn clean install in microservices, start all the 4 applications along with the Zipkin server.
For quick start and stop, use the bat file
Start-all.batandStop-all.bat.
Now test the first service endpoint couple of times from the browser – http://localhost:8081/zipkin.
Please be aware that there is an intentional delay in one of the above 4 services. So there will be a delay in the final response which is expected, just don’t give up.
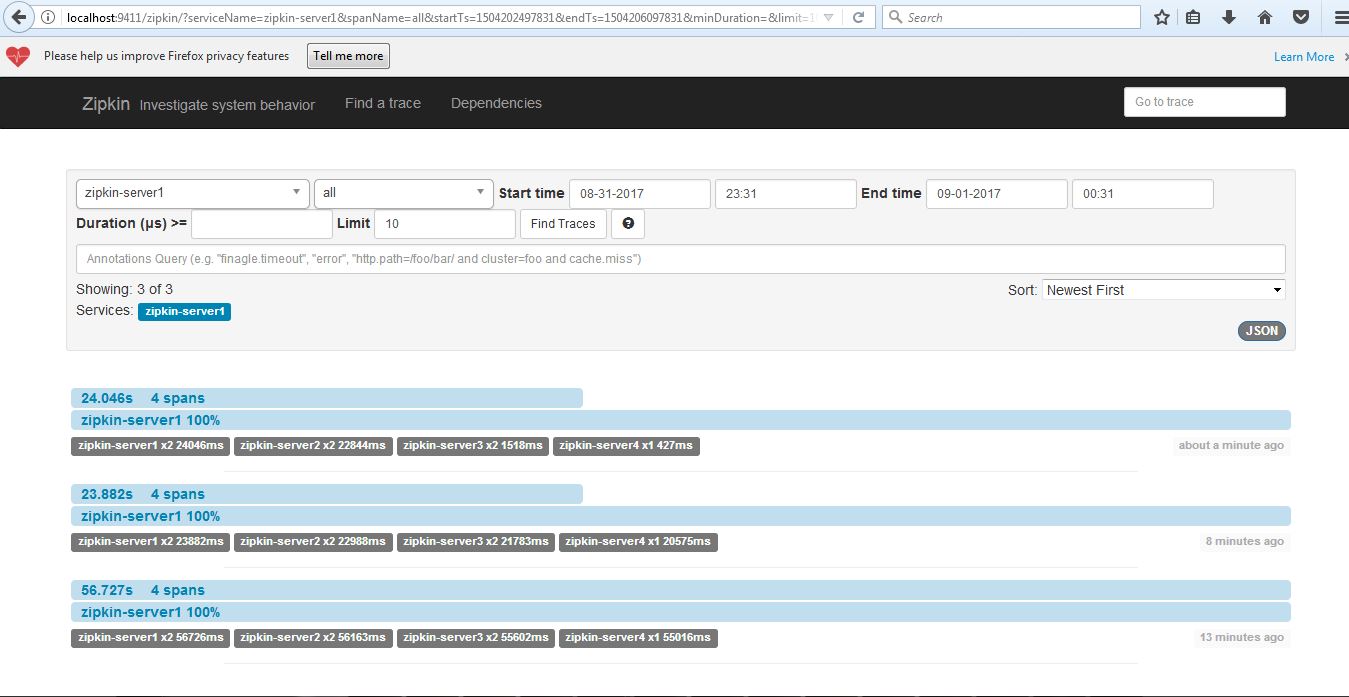
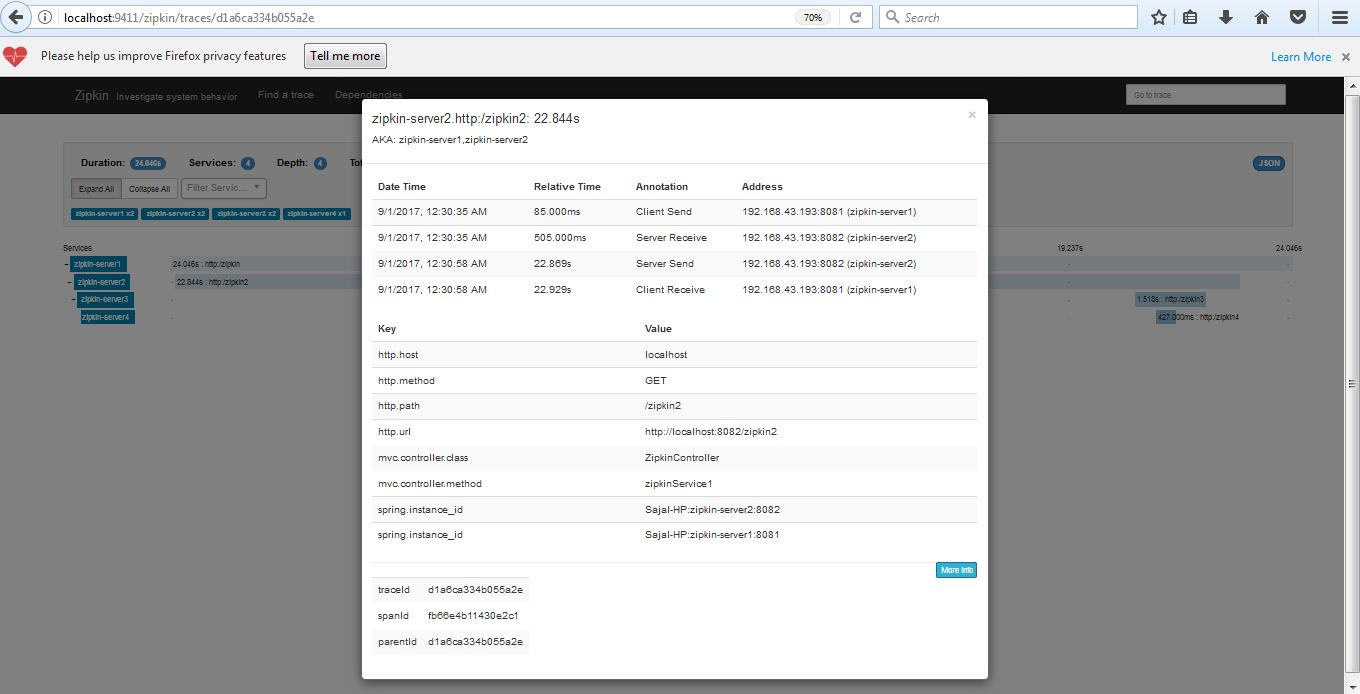
After the API call succeeds, we can see the latency statistics at Zipkin UI http://localhost:9411/zipkin/. Choose the first service in the first drop-down, and once click on the Find Traces button.
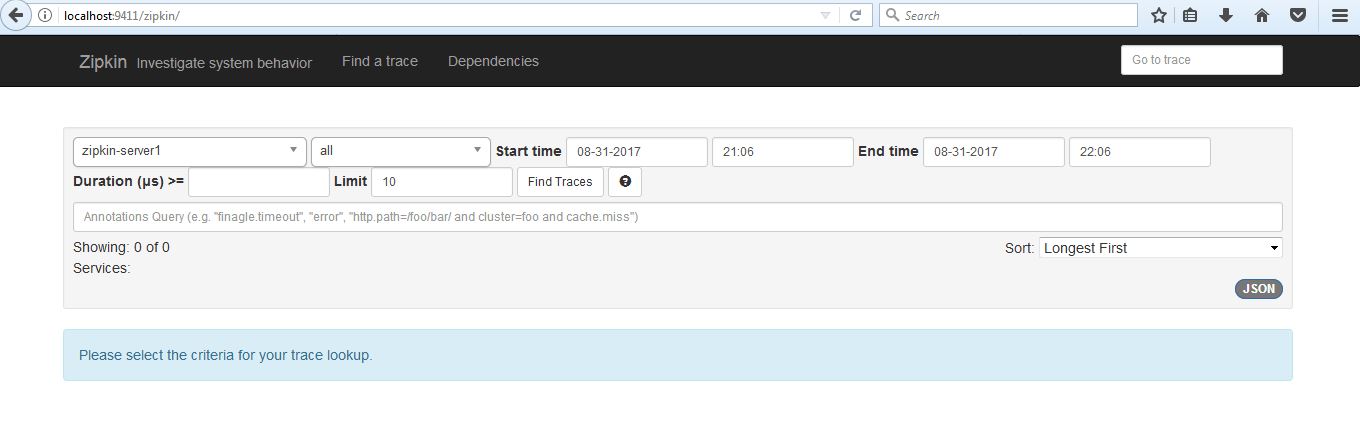
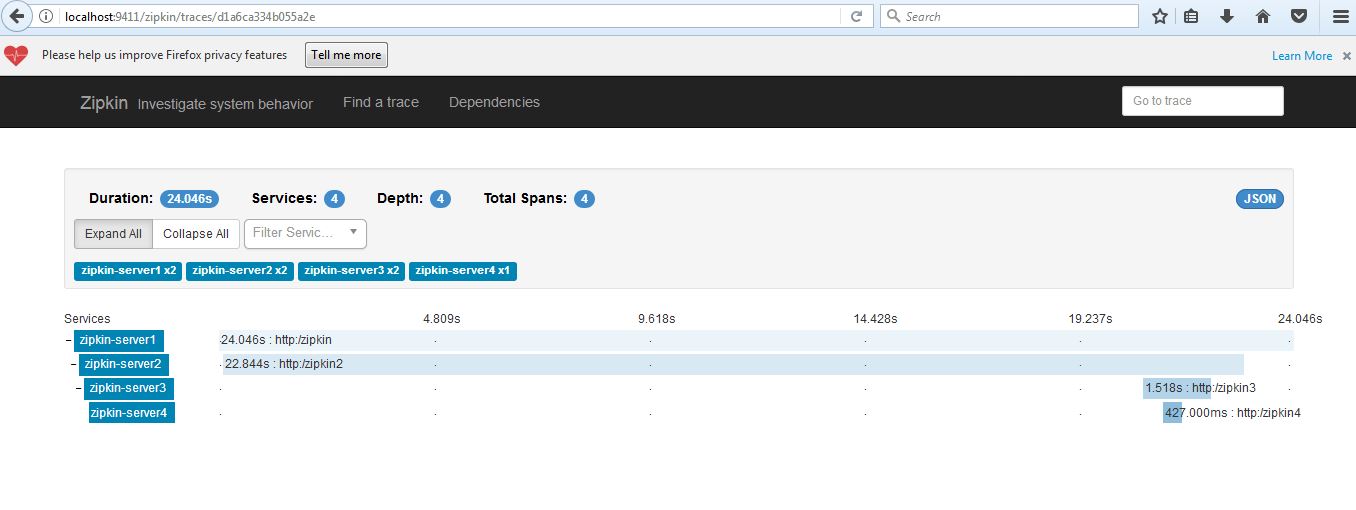
We should see this type of UI where we can do performance analysis by looking at tracing data.
5. Conclusion
In this spring boot distributed tracing tutorial, we learned to use Zipkin to analyze latency in service calls. Also, we learned how Sleuth can help us create the metadata and pass it to Zipkin.
I hope this information will be useful to get started with distributed tracing using Zipkin and Sleuth.
Happy Learning!!!
Hi All,
If I am running multiple instances of Zipkin server, how do I configure the URL’s in Zipkin Client applications ?
I tried spring.zipkin.baseUrl=http://localhost:9411/, http://localhost:9412/
But the above approach did not work for me.
Hello,
How to send customiesd information to zipkin and see it on zipkin console?
Regards
I am having zipkin server running in spring boot 1.0.x and a service running in spring boot 2.0.x, when I made http call to service in console I could see the traces but when I search the same tace id in zipkin server it doesn’t fetch me any results. Can you please help me with this issue?
You have to change this:
for this:
and do not forget:
Can I have zipkin monitor just one microservice HTTP REST endpoints for the
1) Request and Response Time
2) Request received
..
..
Above Program i done step by step i am not getting Above images Port:9411 its not working
How does Sleuth know that the microservice is called by another microservice instead of being called by a separate request e.g. from brower/postman?
Hi,
Is it a good practice to allways send samples to the ZIPKIN server ? wouldn’t that create a lot of overhead if the data becomes huge ? How to filter which requestes should be sampled ?
how service 1 knows, where is zipkin running?
It is done internally via spring boot auto configuration, it’ll configured with most of the time front controller which is used to expose endpoints to world, this time it is spring web mvc thus there internally connected with Dispatcher Servlet. when the Rest Api make the routing through the help of front controller it will automatically aware the Zipkin server because here every service component has define their own zipkin tracker. Just set the Zipkin and Slueth to the project then other part will doing spring boot behalf of developers.
Thanks for the post, downloaded, and it runs fine. If I need to send the trace data to external zipkin server, where can I specify zipkin host and port?
spring.zipkin.base-url=http://localhost:9411/
spring.sleuth.sampler.probability=1
Siddharth Singh
Nice Tutorial :-)