
Spring Boot Actuator is a powerful tool that provides a set of built-in endpoints that expose various information about our Spring application, including health status, application metrics, environment information, and more.
In this article, we will explore the Health Check and Metrics endpoints provided by Spring Boot Actuator, and how we can leverage them to ensure the health and performance of our Spring Boot applications.
1. Important Change in Spring Boot 3
As noted in the Spring Boot 3 migration guide, all values are always masked by default for the /env and /configprops endpoints as they contain sensitive information.
To enable the display of these values in the endpoint responses, we can customize the following properties. The valid values for these properties are: NEVER, ALWAYS and WHEN_AUTHORIZED.
management.endpoint.env.show-values=ALWAYS
management.endpoint.configprops.show-values=ALWAYS
If needed, we can customize the masking of values for other endpoints using the property management.endpoint.<endpoint-name>.show-values.
management.endpoint.info.show-values=WHEN_AUTHORIZED2. Getting Started with Spring Boot Actuator Module
Spring boot’s module Actuator allows you to monitor and manage application usages in the production environment, without coding and configuration for any of them. This monitoring and management information is exposed via REST-like endpoint URLs.
2.1. Maven
The spring-boot-starter-actuator is a starter module for the actuator. It automatically configures various Actuator endpoints and features, making them available out-of-the-box.
<dependency>
    <groupId>org.springframework.boot</groupId>
    <artifactId>spring-boot-starter-actuator</artifactId>
</dependency>
dependencies {
implementation 'org.springframework.boot:spring-boot-starter-actuator'
}2.2. Default Configuration
By default, all endpoints (except /shutdown) are enabled. Only the /health and /info are exposed via Web APIs. Rest are exposed via JMX.
To enable the /shutdown endpoint also, we can use the following property:
management.endpoint.shutdown.enabled=trueAlso, we can use management.endpoints.web.exposure.include=* to expose all endpoints through the Web APIs.
management.endpoints.web.exposure.include=*

# To expose only selected endpoints
#management.endpoints.jmx.exposure.include=health,info,env,beans
An endpoint is considered to be available when it is both enabled and exposed.
2.3. Enabling Only Specific Endpoints
If we prefer to disable all endpoints, by default, and only expose certain endpoints then we can set the property management.endpoints.enabled-by-default to false and then use the only required endpoints that the application needs to expose using the pattern management.endpoint.<id>.enabled.
management.endpoints.enabled-by-default=false

management.endpoint.info.enabled=true
management.endpoint.health.enabled=true
management.endpoint.loggers.enabled=true
3. Important Actuator Endpoints
Actuator endpoints let us monitor and interact with our application. Most applications expose endpoints via HTTP, where the ID of the endpoint along with a prefix of /actuator is mapped to a URL. For example, by default, the health endpoint is mapped to /actuator/health.
Some of the important and widely used actuator endpoints are given below:
| Endpoint | Usage |
|---|---|
/auditevents | Returns all auto-configuration candidates and the reason why they ‘were’ or ‘were not’ applied. |
/beans | Returns a complete list of all the Spring beans in your application. |
/mappings | Displays a collated list of all @RequestMapping paths. |
/env | Exposes the application’s environment properties and configuration. It’s useful for inspecting the configuration values of your application. |
/info | Allows us to expose arbitrary application information. We can configure custom properties to be displayed here, providing metadata about the application. |
/health | Returns application health information. It checks various indicators, such as database connectivity, disk space, and custom health indicators, and presents the overall health status as “UP” or “DOWN.” |
/caches | It exposes available caches. |
/conditions | Shows the conditions that were evaluated on configuration and auto-configuration. |
/configprops | It displays a collated list of all @ConfigurationProperties. |
/integrationgraph | It shows the Spring Integration graph. Requires a dependency on spring-integration-core. |
/loggers | The configuration of loggers in the application. |
/logfile | Allows us to view and download the application’s log file content. |
/scheduledtasks | Displays the scheduled tasks in the application. |
/sessions | Returns trace logs (by default the last 100 HTTP requests). Requires an HttpTraceRepository bean. |
/httptrace | It allows retrieval and deletion of user sessions from a Spring Session-backed session store. Requires a Servlet-based web application using Spring Session. |
/shutdown | Allows the application to gracefully shut down. Disabled by default. |
/threaddump | It performs a thread dump and returns a snapshot of the application’s thread states, which can be valuable for diagnosing thread-related issues. |
/metrics | It shows several useful metrics information like JVM memory used, system CPU usage, open files, HTTP request statistics and more. |
/httpexchanges | Displays HTTP exchange information. Requires an HttpExchangeRepository bean. |
The Spring web applications (Spring MVC, Spring WebFlux, or Jersey) provide the following additional endpoints:
| Endpoint | Usage |
|---|---|
/heapdump | Returns an hprof heap dump file. |
/logfile | Returns the contents of the logfile if logging.file.name or logging.file.path properties have been set. |
/prometheus | Exposes metrics in a format that can be scraped by a Prometheus server. |
4. Actuator Configurations
Apart from enabling and disabling endpoints, we can also configure the following behaviors.
4.1. Securing Endpoints
By default, spring security is enabled for all actuator endpoints if it is available in the classpath. If we wish to configure custom security for HTTP endpoints, for example, only allow users with a certain role to access then configure in the following manner.
The following configuration ensures that only users with the role ADMIN have access to actuation endpoints.
@Configuration(proxyBeanMethods = false)
public class ActuatorSecurity extends WebSecurityConfigurerAdapter {

    @Override
    protected void configure(HttpSecurity http) throws Exception {
        http.requestMatcher(EndpointRequest.toAnyEndpoint()).authorizeRequests((requests) ->
                requests.anyRequest().hasRole("ADMIN"));
        http.httpBasic();
    }

}
In Spring Boot 3, we can rewrite the configuration as follows:
@Configuration(proxyBeanMethods = false)
public class MySecurityConfiguration {

    @Bean
    public SecurityFilterChain securityFilterChain(HttpSecurity http) throws Exception {
        http.securityMatcher(EndpointRequest.toAnyEndpoint());
        http.authorizeHttpRequests((requests) -> requests.anyRequest().hasRole("ADMIN"));
        http.httpBasic(withDefaults());
        return http.build();
    }

}
If the application is already behind the firewall, we can disable the security altogether by setting the management.security.enabled to false.
management.security.enabled=false4.2. CORS Support
CORS support is disabled by default and is only enabled once we have set the management.endpoints.web.cors.allowed-origins property as follows.
management.endpoints.web.cors.allowed-origins=https://example.com
management.endpoints.web.cors.allowed-methods=GET,POST
4.3. Caching the Response
Actuator endpoints automatically cache the responses to read operations that do not take any parameters. Use cache.time-to-live property to configure the amount of time for which an endpoint will cache the response.
management.endpoint.info.cache.time-to-live=10s5. Demo Setup
In this example, we will create a simple spring boot application and access the actuator endpoints to learn more about them.
5.1. Development environment
- JDK 17, IntelliJ, Maven – Development environment
- Spring-Boot 3 – Underlying application framework
- Spring-Boot Actuator – Management endpoints
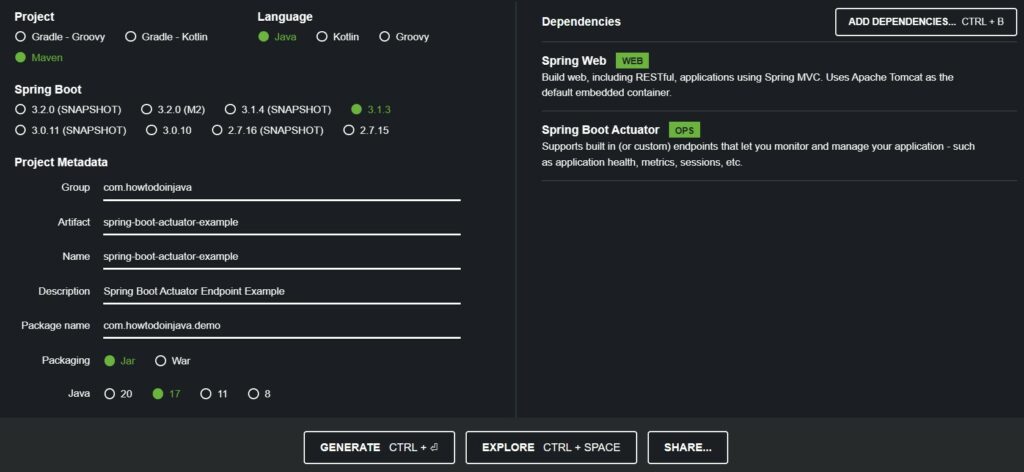
5.2. Create a Maven Project
Start with creating one spring boot project from the Spring Initializer site with Web and Actuator dependencies. Download the project in zipped format. Unzip and then import the project to your favorite IDE.
5.3. Add a Rest Endpoint
Now add one simple Rest endpoint /example to the application.
import java.time.LocalDateTime;
import org.springframework.web.bind.annotation.GetMapping;
import org.springframework.web.bind.annotation.RestController;

@RestController
public class SimpleRestController {
	@GetMapping("/example")
	public String example() {
		return "Hello User !! " + LocalDateTime.now();
	}
}
6. Spring Boot Actuator Endpoints in Action
Note that we have added management.security.enabled=false to the application.properties file to disable actuator security. Here we are more interested in responses from the actuator endpoints.
Start the application and access /example API in the browser to generate monitoring information on the server. Now we will access the generated information.
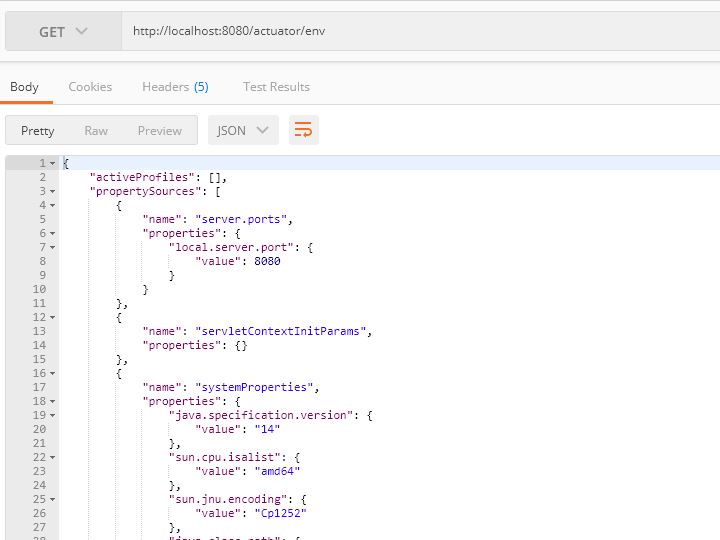
6.1. The ‘/env‘ Endpoint
It will give all the environmental configurations of the server.
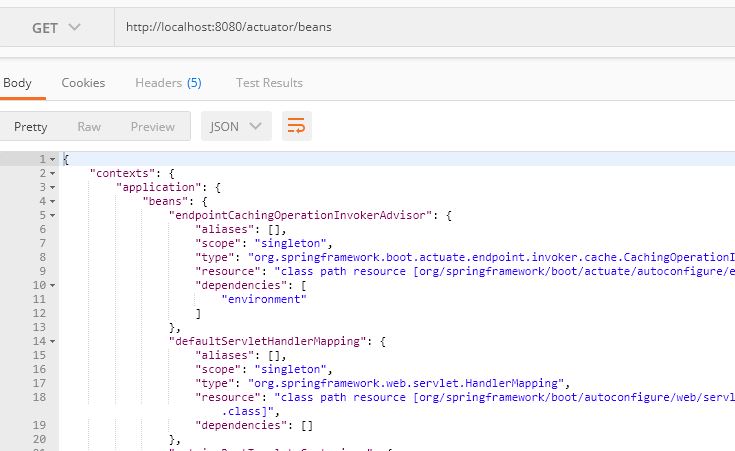
6.2. The ‘/beans‘ Endpoint
Gives information of all the beans loaded on the server.
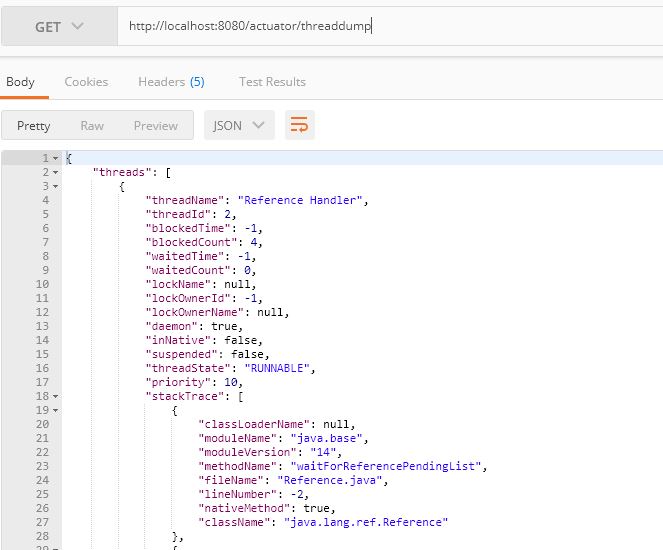
6.3. The ‘/threaddump‘ Endpoint
This will give the current server thread dump.
Those endpoints will give standard information in the browser. These are the basic important endpoints we generally refer to, but Spring Boot provides many more endpoints as mentioned in this link
7. Advanced Configurations
7.1. Change the Management Endpoint Context Path
By default, all endpoints are accessible by the default context path of the application, suffixed with /actuator. If for some reason, we have existing endpoints in the application starting with /actuator then we can customize the base path to something else.
All we need to specify the new base path in the application.properties.
management.endpoints.web.base-path=/manageNow you will be able to access all actuator endpoints under a new URL. e.g.
- /manage/health
- /manage/dump
- /manage/env
- /manage/beans
7.2. Customize the Management Server Port
To customize the management endpoint port, we need to add this entry to the application.properties file.
management.server.port=80818. Conclusion
In this spring boot actuator example, we learned to configure management and monitoring endpoints with a few easy configurations. By including spring-boot-starter-actuator and configuring the properties as needed, we can easily harness the power of Spring Boot Actuator’s default autoconfiguration to monitor and manage our Spring Boot applications in a production-ready manner.
Feel free to drop your questions in the comments section.
Happy Learning !!