

Data analytics is the process of examining data to answer a specific question, so that a person or a business can make a decision based on facts instead of guesses. Before the analysis starts, we collect the data and clean it, because raw data almost always has duplicates and missing values.
Shops use data analytics to find their best-selling products, and hospitals use it to plan staff for busy hours. Apps use it to see where users stop using a feature, and banks use it to spot unusual card payments.
The following example answers one such question for a small bakery, namely which product brings in the most money. The answer comes from a single SQL query on a table of orders, which we build from a CSV file in section 7.
SELECT product,
       SUM(quantity * unit_price) AS revenue
FROM sales
GROUP BY product
ORDER BY revenue DESC;

-- product   revenue
-- cake        140.0
-- bread        75.0
-- cookies      36.0
Notice that the result is a fact the bakery can act on, for example by baking more cakes before a holiday.
In rest of the article, after the definition of data analytics, we cover the four types of analytics and the process step by step. After that come the skills and free tools to learn, a 12-week plan for beginners, and the full bakery example with the cleaning steps in SQL and Python.
1. What Is Data Analytics?
A list of orders, clicks or sensor readings does not answer anything by itself. Data analytics turns that raw data into an answer, such as a total, a trend or a comparison, and it starts from a question that someone needs answered.
Data analytics is often confused with three related fields that work on the same data. The difference is the question each one answers and what it delivers at the end.
| Field | Main question | Typical tools | Typical output |
|---|---|---|---|
| Data analytics | What happened, and why? | Spreadsheets, SQL, Python, Power BI, Tableau | A report, a chart or an answer to one question |
| Business intelligence (BI) | How are we doing today? | Power BI, Tableau, SQL | Dashboards that update every day |
| Data science | What will happen next? | Python, statistics, machine learning libraries | A model that makes predictions |
| Data engineering | How do we get clean data to everyone? | SQL, Python, Java, pipeline tools | Reliable data pipelines and tables |
A data analyst answers defined questions about the past and the present, while a data scientist builds models that predict the future. Many people start as analysts and move into data science later, because the first skills, SQL and basic statistics, are the same.
2. The Four Types of Data Analytics
Analysts group their work into four types by the question it answers. Each type builds on the one before it, so we can only explain why revenue dropped once we know that it dropped.

Descriptive and diagnostic analytics need only counting, grouping and comparing, which we can do in a spreadsheet or with SQL. Predictive and prescriptive analytics need statistics or machine learning, so they come later in the learning path.
3. The Data Analytics Process
Every analysis follows the same six steps, whether it takes ten minutes in a spreadsheet or two weeks on a company database. The result of one analysis often raises the next question, so the steps repeat as a cycle.
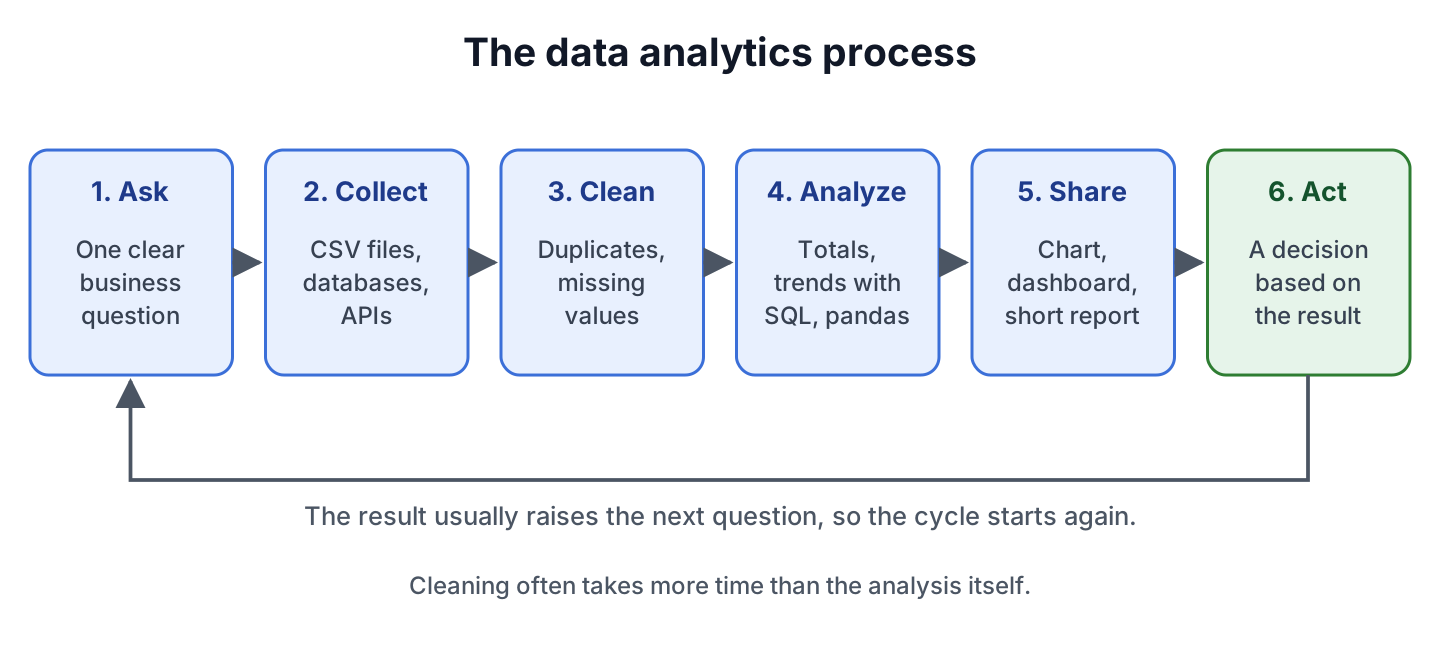
Each step produces something concrete that the next step uses. In the bakery example from section 7, the steps look like this.
| Step | What we do | Bakery example |
|---|---|---|
| 1. Ask | Write one question that has a clear answer | Which product brings in the most money? |
| 2. Collect | Get the data from a file, a database or an API (a web service that returns data) | Export the orders to bakery_sales.csv |
| 3. Clean | Remove duplicates, fill or drop missing values, fix formats | Drop the duplicated order 7 and order 9, which has no quantity |
| 4. Analyze | Group, count, sum and compare | Sum quantity times price for each product |
| 5. Share | Show the answer in a chart or a short report | A bar chart of revenue per product |
| 6. Act | Make a decision and measure its effect | Bake more cakes, then check next month’s revenue |
Beginners often expect the analysis step to take the most time. In real projects, cleaning often takes longer, because company data has typos, duplicates and gaps that we have to find before any total is correct.
4. What Does a Data Analyst Do?
A data analyst spends most of the day turning questions from managers and other teams into numbers. Job postings use titles such as data analyst, business analyst, BI analyst and reporting analyst for this work, and a typical week includes the following tasks.
- Writing SQL queries to pull data from the company database.
- Cleaning and joining data from several sources, such as a sales system and a spreadsheet from the marketing team.
- Building and updating dashboards that managers check every week.
- Explaining a result to people without a technical background, often in a short slide deck or a written summary.
The US Bureau of Labor Statistics does not list data analyst as a separate occupation, so the closest official numbers are for data scientists, a role many analysts grow into. Data scientists earned a median of $120,230 a year in 2025, and the BLS projects 35% job growth from 2025 to 2035, much faster than the average for all occupations. The BLS numbers describe experienced data scientists, so entry-level analyst pay starts lower.
5. Skills and Tools to Learn
Data analytics needs only a few skills to start, and every one of them has a free tool. The order matters, because each skill builds on the one before it.
| Order | Skill | Free tools to start with | What we use it for |
|---|---|---|---|
| 1 | Spreadsheets | Google Sheets (free), Microsoft Excel (paid) | Sorting, filtering, formulas and pivot tables on small data |
| 2 | SQL | DuckDB, SQLite, PostgreSQL | Reading, filtering, grouping and joining data in databases |
| 3 | Basic statistics | A spreadsheet or Python | Averages, medians and percentages; for example, the median ignores one huge order that would push the average up |
| 4 | Data visualization | Power BI Desktop, Tableau Public | Charts and dashboards that show the answer at a glance |
| 5 | Python | Python with pandas, Jupyter notebooks | Cleaning large files and repeating an analysis on a schedule |
| 6 | Communication | Slides, a short written report | Explaining the result and the decision it supports |
SQL is the skill to learn right after spreadsheets, because most company data lives in databases and SQL is how analysts read it. Python comes later, when files get too large for a spreadsheet or when the same analysis has to run every week. Power BI Desktop runs only on Windows, so Mac users can build their charts in Tableau Public instead.
Developers who already know Java can read the same files in Java, for example CSV files with OpenCSV and Excel files with Apache POI. Most analyst jobs still ask for SQL and Python, so those two are worth learning even for Java developers.
6. How to Get Started With Data Analytics in 12 Weeks
A steady pace of about 10 hours a week works better than a few long weekends. The plan below covers the basics in 12 weeks, and each phase ends with something we can show, which later becomes part of a portfolio.
| Weeks | Goal | Practice | Done when |
|---|---|---|---|
| 1-2 | Spreadsheet basics | Sort, filter, SUMIF and pivot tables (tables that total values per category) on a public dataset | We can answer “total per category” with a pivot table |
| 3-5 | SQL | SELECT, WHERE, GROUP BY, JOIN on a sample database | We can write the queries in section 7 without looking |
| 6-7 | Statistics and charts | Averages, medians, percentages; build three charts in Power BI or Tableau Public | We can explain why a median is sometimes better than an average |
| 8-9 | Python and pandas | Load a CSV file, clean it, group it, plot it | We can repeat a spreadsheet analysis in a Python script |
| 10-12 | First portfolio project | Pick a Kaggle dataset we care about and run the full process | A GitHub repo with the data, the queries, three charts and a one-page summary |
Twelve weeks covers the basics, not a first job. Becoming job-ready takes longer, and two or three finished projects with clear write-ups help more than a long list of course certificates.
7. A First Data Analysis in SQL and Python
The best way to understand the process is to run it once on a small file. The complete files are in the data-analytics-getting-started folder on GitHub, and with Python 3.13 installed, three commands run both versions of the analysis.
pip install pandas==3.0.6 duckdb==1.5.6
python run_sql.py
python analysis.py
We can also type the SQL queries into the DuckDB command-line tool or a Jupyter notebook (a browser page that runs code cell by cell) instead of running the scripts.
7.1. The Sample Data
The following example is a small bakery that sells bread, cake and cookies. Each row of bakery_sales.csv is one order with a date, a product, a quantity and a unit price, and the file has 14 rows.
order_id,order_date,product,quantity,unit_price
1,2026-01-05,bread,4,3.00
2,2026-01-05,cake,1,20.00
3,2026-01-12,cookies,6,1.50
4,2026-01-19,bread,5,3.00
5,2026-01-26,cake,2,20.00
6,2026-02-02,bread,3,3.00
7,2026-02-09,cookies,10,1.50
7,2026-02-09,cookies,10,1.50
8,2026-02-16,cake,1,20.00
9,2026-02-23,bread,,3.00
10,2026-03-02,bread,6,3.00
11,2026-03-09,cake,3,20.00
12,2026-03-16,cookies,8,1.50
13,2026-03-23,bread,7,3.00
Notice the two problems that real exports often have. Order 7 appears twice, and order 9 has no quantity, so both rows would make the totals wrong.
7.2. Cleaning and Analyzing the Data With SQL
We use DuckDB 1.5.6, a free database that runs SQL on a CSV file without a server. The first statement cleans the data into a new table, where SELECT DISTINCT removes the duplicated row and the WHERE clause drops the row without a quantity.
-- 1. Clean the data
CREATE TABLE sales AS
SELECT DISTINCT *
FROM 'bakery_sales.csv'
WHERE quantity IS NOT NULL;               -- 12 rows

-- 2. Revenue per product
SELECT product,
       SUM(quantity * unit_price) AS revenue
FROM sales
GROUP BY product
ORDER BY revenue DESC;                    -- cake 140.0, bread 75.0, cookies 36.0

-- 3. Revenue per month
SELECT strftime(order_date, '%Y-%m') AS month,
       SUM(quantity * unit_price) AS revenue
FROM sales
GROUP BY month
ORDER BY month;                           -- 2026-01 96.0, 2026-02 44.0, 2026-03 111.0

-- 4. Why was February weaker? Cakes sold per month
SELECT strftime(order_date, '%Y-%m') AS month,
       SUM(quantity) AS cakes
FROM sales
WHERE product = 'cake'
GROUP BY month
ORDER BY month;                           -- 2026-01 3, 2026-02 1, 2026-03 3
We can see that February brought in less than half of January’s revenue, which is a descriptive answer. The fourth query is diagnostic, because it asks why, and it shows that February sold one cake against three in January, and each cake costs $20.
7.3. The Same Analysis With Python and pandas
The same steps in Python use pandas 3.0.6 on Python 3.13, with pandas imported as pd. The method drop_duplicates() removes the repeated row, and dropna() removes the row with the missing quantity. The full script in analysis.py adds the import and the print statements.
sales = pd.read_csv("bakery_sales.csv", parse_dates=["order_date"])   # 14 rows
sales = sales.drop_duplicates()                                        # 13 rows
sales = sales.dropna(subset=["quantity"])                              # 12 rows
sales["revenue"] = sales["quantity"] * sales["unit_price"]

by_product = sales.groupby("product")["revenue"].sum().sort_values(ascending=False)
# cake 140.0, bread 75.0, cookies 36.0

by_month = sales.groupby(sales["order_date"].dt.strftime("%Y-%m"))["revenue"].sum()
# 2026-01 96.0, 2026-02 44.0, 2026-03 111.0
Both versions give the same numbers. SQL is the shorter choice when the data already sits in a database, whereas pandas is handy when we also want to plot the result or combine several files in one script.
7.4. Sharing the Result
A manager does not want to read a query result, so the last step is a chart that shows the answer in one look. A sorted bar chart works well for comparing a few products.

Without the cleaning step, the duplicated order would have added $15 to cookies, and the bread total would depend on how the tool treats an empty quantity. Wrong totals in a chart lead to wrong decisions, which is why cleaning comes before analysis.
8. Free Courses, Datasets and Certificates
Most of what a beginner needs is free, and one paid certificate gives the learning a fixed structure. The prices below are from each provider’s page in October 2026.
| Resource | What we get | Cost |
|---|---|---|
| Google Data Analytics Certificate | About 240 hours on Coursera covering spreadsheets, SQL, Python and Tableau; no experience or degree required | $49/month in the US and Canada after a 7-day free trial |
| Kaggle Learn | Short courses on Python, pandas and data visualization, plus thousands of public datasets | Free |
| Tableau Public | Charts and dashboards that we publish online for a portfolio | Free; everything we publish is public |
| Power BI Desktop | Reports and dashboards on our own computer | Free; sharing reports with others needs Power BI Pro at $14/user/month, paid yearly |
9. Common Beginner Mistakes
Most beginners get stuck for the same few reasons, and each one has a fix that takes less than a day to apply.
| Mistake | Fix |
|---|---|
| Learning tools without a question to answer | Start every practice session with one question, such as “which month sold the most?” |
| Trusting the data as it arrives | Count the rows, look for duplicates and empty values, and check the minimum and maximum of every number column |
| Studying for months before analyzing anything | Run a small end-to-end analysis in a spreadsheet in the first week, and repeat it with SQL and Python as we learn them, like in section 7 |
| Learning five tools at once | Follow the order in section 5 and finish one tool before starting the next |
| Charts that need a long explanation | Give every chart a title that states the answer, such as “Cake brings in the most revenue” |
10. Data Analytics FAQs
Most of these questions come from people deciding whether data analytics is worth the time to learn.
10.1. Can I Become a Data Analyst Without a Degree?
Yes, but it takes proof of skills instead. The Google certificate requires no degree or experience, and a portfolio of two or three finished projects shows employers that we can do the work.
10.2. How Long Does It Take to Learn Data Analytics?
About 12 weeks at 10 hours a week covers the basics, as in the plan in section 6. The Google certificate goes further and estimates about 240 hours, which is three months at 20 hours a week or six months at 10 hours a week.
10.3. Do I Need Advanced Math for Data Analytics?
No. High-school math such as percentages, averages and reading a graph is enough to start, and basic statistics comes later in the plan.
10.4. Will AI Replace Data Analysts?
AI tools already write first drafts of SQL queries and suggest charts, and tools like Spring AI can generate SQL from a question. Someone still has to choose the right question, check that the query and the data are correct, and explain the result, so analysts who use these tools get more done instead of being replaced by them.
10.5. What Is the Difference Between a Data Analyst and a Data Scientist?
A data analyst answers defined business questions with existing data, whereas a data scientist builds statistical or machine learning models that predict outcomes. The table in section 1 compares both roles with business intelligence and data engineering.
11. Conclusion
Data analytics starts with a question and ends with a decision, and the steps in between are the same for a bakery and a large company. Cleaning the data is the step that beginners skip most often and the one that decides whether the totals are right.
To start, we learn spreadsheets and SQL first, then charts, then Python, and run one small analysis end to end in the first week. A few finished projects on real datasets teach more than any list of courses.
12. References
- BLS Occupational Outlook Handbook, Data Scientists
- DuckDB CSV Import
- The pandas User Guide
- Google Data Analytics Certificate
- Kaggle Learn
- Tableau Public
- Power BI Desktop
Happy Learning !!
